AWS CloudTrail

Amazon Web Services (AWS) CloudTrail records API calls made to AWS. The Sumo Logic App for CloudTrail ingests these logs, providing greater visibility into events that, in turn, allows for security and operations forensics. For example, you can use the Sumo Logic App for CloudTrail to analyze raw CloudTrail data to investigate user behavior patterns. Or, by correlating CloudTrail data with other data sets, you can get a broader understanding of events from operating systems, intrusion detection systems, or even application logs.
Sample log messages​
{
   "eventVersion":"1.01",
   "userIdentity":{
      "type":"IAMUser",
      "principalId":"AIDAJ6IGVQ4XQZQDAYEOA",
      "arn":"arn:aws:iam::956882708938:user/Olaf",
      "accountId":"956882708938",
      "userName":"system"
   },
   "eventTime":"2017-09-27T20:00:10Z",
   "eventSource":"signin.amazonaws.com",
   "eventName":"ConsoleLogin",
   "awsRegion":"us-east-1",
   "sourceIPAddress":"65.98.119.36",
   "userAgent":"Mozilla/5.0 (Macintosh; Intel Mac OS X 10_9_5) AppleWebKit/537.36 (KHTML, like Gecko) Chrome/37.0.2062.124 Safari/537.36",
   "requestParameters":null,
   "responseElements":{
      "ConsoleLogin":"Failure"
   },
   "additionalEventData":{
      "MobileVersion":"No",
      "LoginTo":"https://console.aws.amazon.com/console/home?state\u003dhashArgs%23\u0026isauthcode\u003dtrue",
      "MFAUsed":"No"
   },
   "eventID":"f36c1d07-73cf-4ab8-84b1-04c93ac2aaeb"
}
Sample queries​
_sourceCategory=AWS_EAGLE (*Security* OR *Network*)
| parse "\"userName\":\"*\"" as user
| parse "\"eventName\":\"*\"" as event
| parse regex field=event "^(?<event_type>[A-Z][a-z]+?)[A-Z]"
| where (event matches "*Security*" OR event matches "*Network*") and event_type in ("Create","Delete")
| count by event
| sort _count
In some cases, your query results may show "HIDDEN_DUE_TO_SECURITY_REASONS" as the value of the userName field. That's because AWS does not log the user name that was entered when a sign-in failure is caused by an incorrect user name.
Prerequisites​
Before you begin, you must configure AWS CloudTrail logging to an S3 bucket in your AWS account. Additionally, confirm that logs are being delivered to the S3 Bucket you’ll use to send the logs to Sumo Logic.
- Configure AWS CloudTrail in your AWS account.
- Confirm that logs are being delivered to the Amazon S3 bucket.
Collecting logs for the AWS CloudTrail App​
This section has instructions for configuring log collection for the AWS CloudTrail app. If you have more than one environment that generates CloudTrail data (such as ops, dev, and so on) you’ll need to configure a separate S3 Source for each environment. Learn more here.
To configure an AWS CloudTrail Source, perform these steps:
- Add an AWS CloudTrail Source to Sumo Logic.
- Grant Sumo Logic access to an Amazon S3 bucket.
- Generate the Role-Based Access CloudFormation template in Sumo Logic and download the template.
- Create the CloudFormation stack in AWS Management Console using the template.
- Copy the Role ARN from the Outputs tab and paste it in the Role ARN field in Sumo Logic CloudTrail Source created in step 3. For more information, refer Configuring your AWS source with CloudFormation.
- Enable Sumo to track AWS Admin activity. This step is optional, but if you do not do it, the administrator activity panels in the AWS CloudTrail - User Monitoring dashboard won't be populated.
- Install the Sumo Logic App for AWS CloudTrail.
Once you begin uploading data, your daily data usage will increase. It's a good idea to check the Account page to make sure that you have enough quota to accommodate additional data in your account. If you need additional quota, you can upgrade your account at any time.
Field Extraction Template​
| parse "\"sourceIPAddress\":\"*\"" as source_ipaddress
| parse "\"eventName\":\"*\"" as event_name
| parse "\"eventSource\":\"*\"" as event_source
| parse "\"awsRegion\":\"*\"" as aws_Region
| parse "\"userName\":\"*\"" as user
Enable Sumo Logic to track AWS Admin Activity​
To track Admin activity in your AWS account, and to provide data for all Administrator Activity panels in the User Monitoring Dashboard, you'll need to inform Sumo Logic for the Admin AWS account. You can do this by uploading a CSV file via HTTP Source.
This step is optional. But if you skip this step, three Administrator Activity panels in the app won't be populated (since the Sumo Logic service won't be aware of the specific activity of each Admin user). All other panels will work properly and will display information.
Configure an HTTP Source​
- Configure an HTTP Source on a Hosted Collector, either the collector where you installed CloudTrail source, or another collector, if you prefer. Use the using the following settings:
- For Name, enter Administrative Users.
- For Source Category, enter admin_users.
- Deselect Enable Timestamp Parsing.
- All other options can use the default settings; optional fields can be left blank.
- Click Save, and make a note of the generated URL for the source.
Upload admin_users File to Sumo​
- Create a file named
admin_users.csvthat contains a list of all the AWS usernames of Admin(s) in your AWS account, including one username on each line. For example:
dtaylor
landerson
athomas
rjackson
Your organization's usernames may look different; make sure that only one user name is on each line.
- Upload the admin_users.csv file to the HTTP Source. For example, using cURL, you’d type
curl -X POST -T admin_users.csv “<url>"making sure to replace<url>with the unique URL generated for your HTTP Source. - To verify that the data has uploaded, run the following search after about 10 minutes:
_sourceCategory=admin_users - If the search returns the correct result, run the following search to save the data to a shared location that can be referenced by the Panels in the CloudTrail app:
_sourceCategory=admin_users
| parse "*" as admin_user
| count as count by admin_user
| fields -count
| save /shared/aws/cloudtrail/admin_users
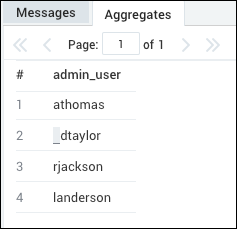
Your search results should look similar to:
Installing the AWS CloudTrail App​
Now that you have set up collection for AWS CloudTrail, install the Sumo Logic App for CloudTrail to use the pre-configured searches and dashboards that provide visibility into your environment.
To install the app:
- Select App Catalog.
- In the 🔎 Search Apps field, run a search for your desired app, then select it.
- Click Install App.
note
Sometimes this button says Add Integration.
- On the next configuration page, under Select Data Source for your App, complete the following fields:
- Data Source. Select one of the following options:
- Choose Source Category and select a source category from the list; or
- Choose Enter a Custom Data Filter, and enter a custom source category beginning with an underscore. For example,
_sourceCategory=MyCategory.
- Folder Name. You can retain the existing name or enter a custom name of your choice for the app.
- All Folders (optional). The default location is the Personal folder in your Library. If desired, you can choose a different location and/or click New Folder to add it to a new folder.
- Data Source. Select one of the following options:
- Click Next.
- Look for the dialog confirming that your app was installed successfully.

Post-installation
Once your app is installed, it will appear in your Personal folder or the folder that you specified. From here, you can share it with other users in your organization. Dashboard panels will automatically start to fill with data matching the time range query received since you created the panel. Results won't be available immediately, but within about 20 minutes, you'll see completed graphs and maps.
What if my data isn't displaying in all Panels?
Scan interval issues​
Amazon S3 buckets are scanned for new files according to the Scan Interval you set when configuring the S3 Source used for AWS CloudTrail logs. Even if you set a shorter Scan Interval, say five minutes, if no new files are found, the Scan Interval is automatically doubled, up to 24 hours (you can read more in Set the S3 Source Scan Interval). If the Scan Interval increases, it means that a Panel set to a 60-minute time range may not find any data to display, because no files have uploaded to Sumo Logic. This isn't to say that no data is being collected from your S3 bucket; you can confirm that data is being collected on the Status page.
Additionally, you can change the time range of a Panel. Even though these have been preconfigured, they can be edited just like any other Panel. You'll find instructions in Changing the Time Range of a Panel.
AWS Admin activity not tracked​
To track Admin activity in your AWS account, and to provide data for all Administrator Activity Panels in the User Monitoring Dashboard, you need to supply a list of admin users to Sumo. For instructions see Enable Sumo to Track AWS Admin Activity
Configuring the AWS CloudTrail App in Multiple Environments​
If you have more than one environment that generates CloudTrail data (such as ops, dev, and so on) you’ll need to configure a separate S3 Source for each environment.
This way, you’ll have the three app dashboards for each environment.
To avoid confusion, and in order to identify which environment is generating data, you should name each S3 Source with the environment's name. For example, you might name your Sources as something like: CloudTrail-prod, CloudTrail-dev, CloudTrail-test, etc.
Finally, make copies of each Panel in the CloudTrail Dashboards, and modify the search logic in each Panel so that you select the appropriate source for each environment.
For example, for a production environment, you will add the string: _source=CloudTrail-production to the beginning of each search. Edit the names of the Panels as needed. This means if you have three environments then you will have three copies of the application for each of them (nine dashboards in total).
Viewing AWS CloudTrail Dashboards​
AWS CloudTrail - Overview​
See an overview of your AWS users, resources, network and security events. The panels present information about top 10 users, failed logins, user locations, and resource creation and deletion.
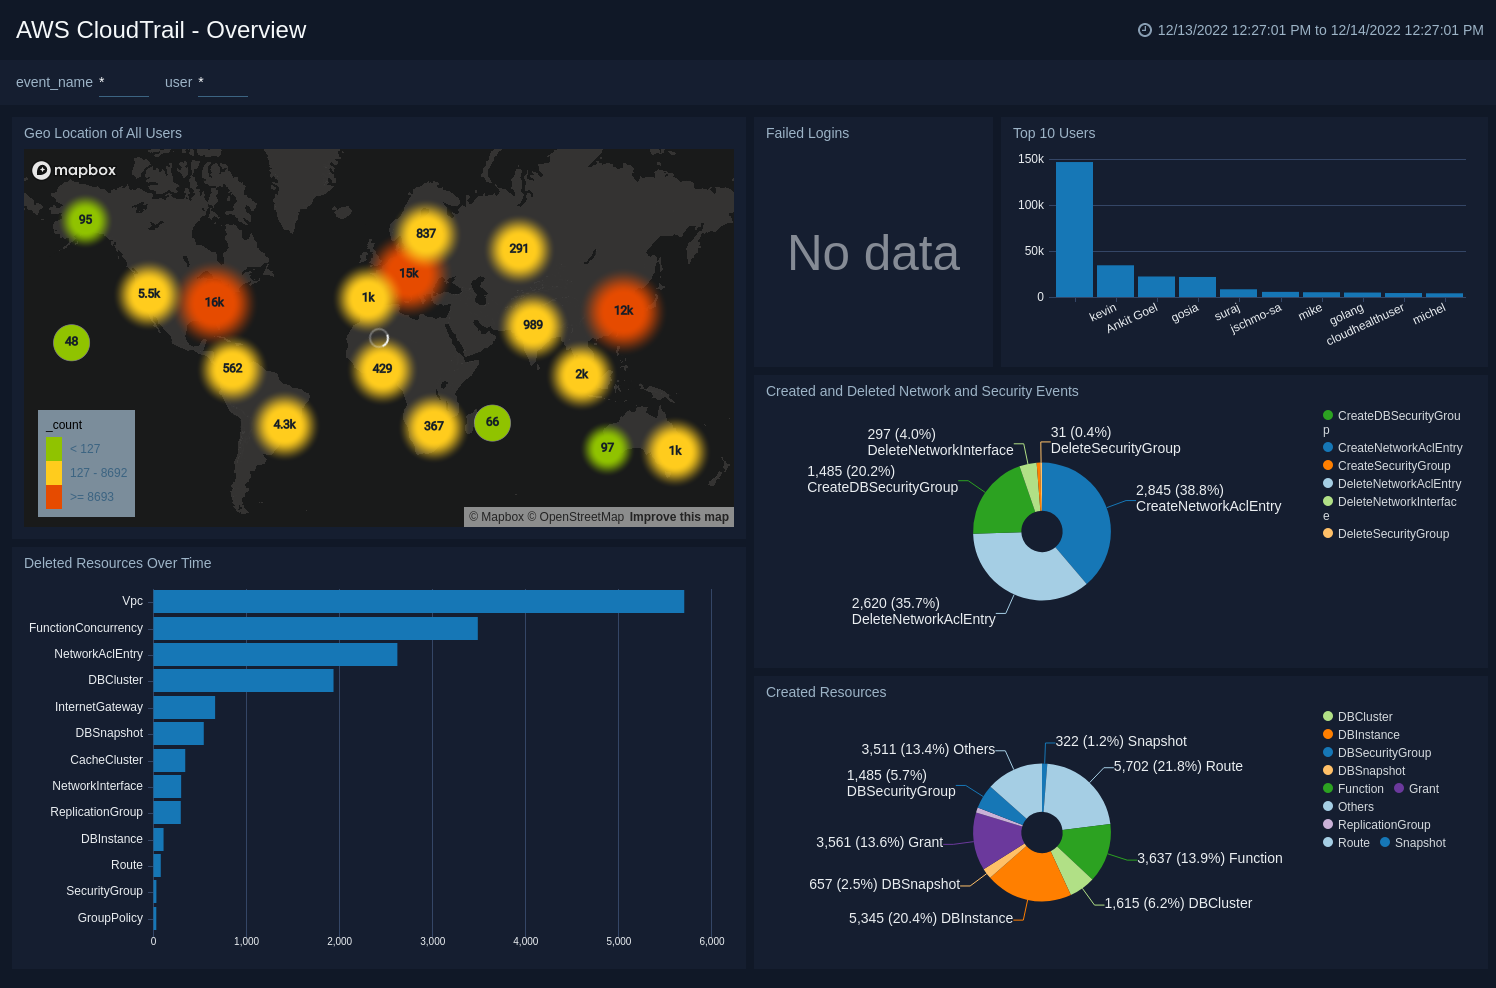
Geo Location of All Users. Using a geolocation search, shows the locations of the IPs used by visitors on a map of the world.
Created Resources. Displays a day’s worth of created resources for 24 hours in a pie chart.
Deleted Resources Over Time. Displays the resources deleted over the past 24 hours in a bar chart.
Top 10 Users. This panel displays the top 10 most active AWS users in a column chart for the past 24 hours.
Failed Logins. Displays the number of failed logins for the past 24 hours in a single value chart.
Created and Deleted Network and Security Events. Displays a pie chart of created or deleted events for the past 24 hours.
AWS CloudTrail - User Monitoring​
See information about your AWS users, including user locations, administrative activities, and instance launch and termination by users.
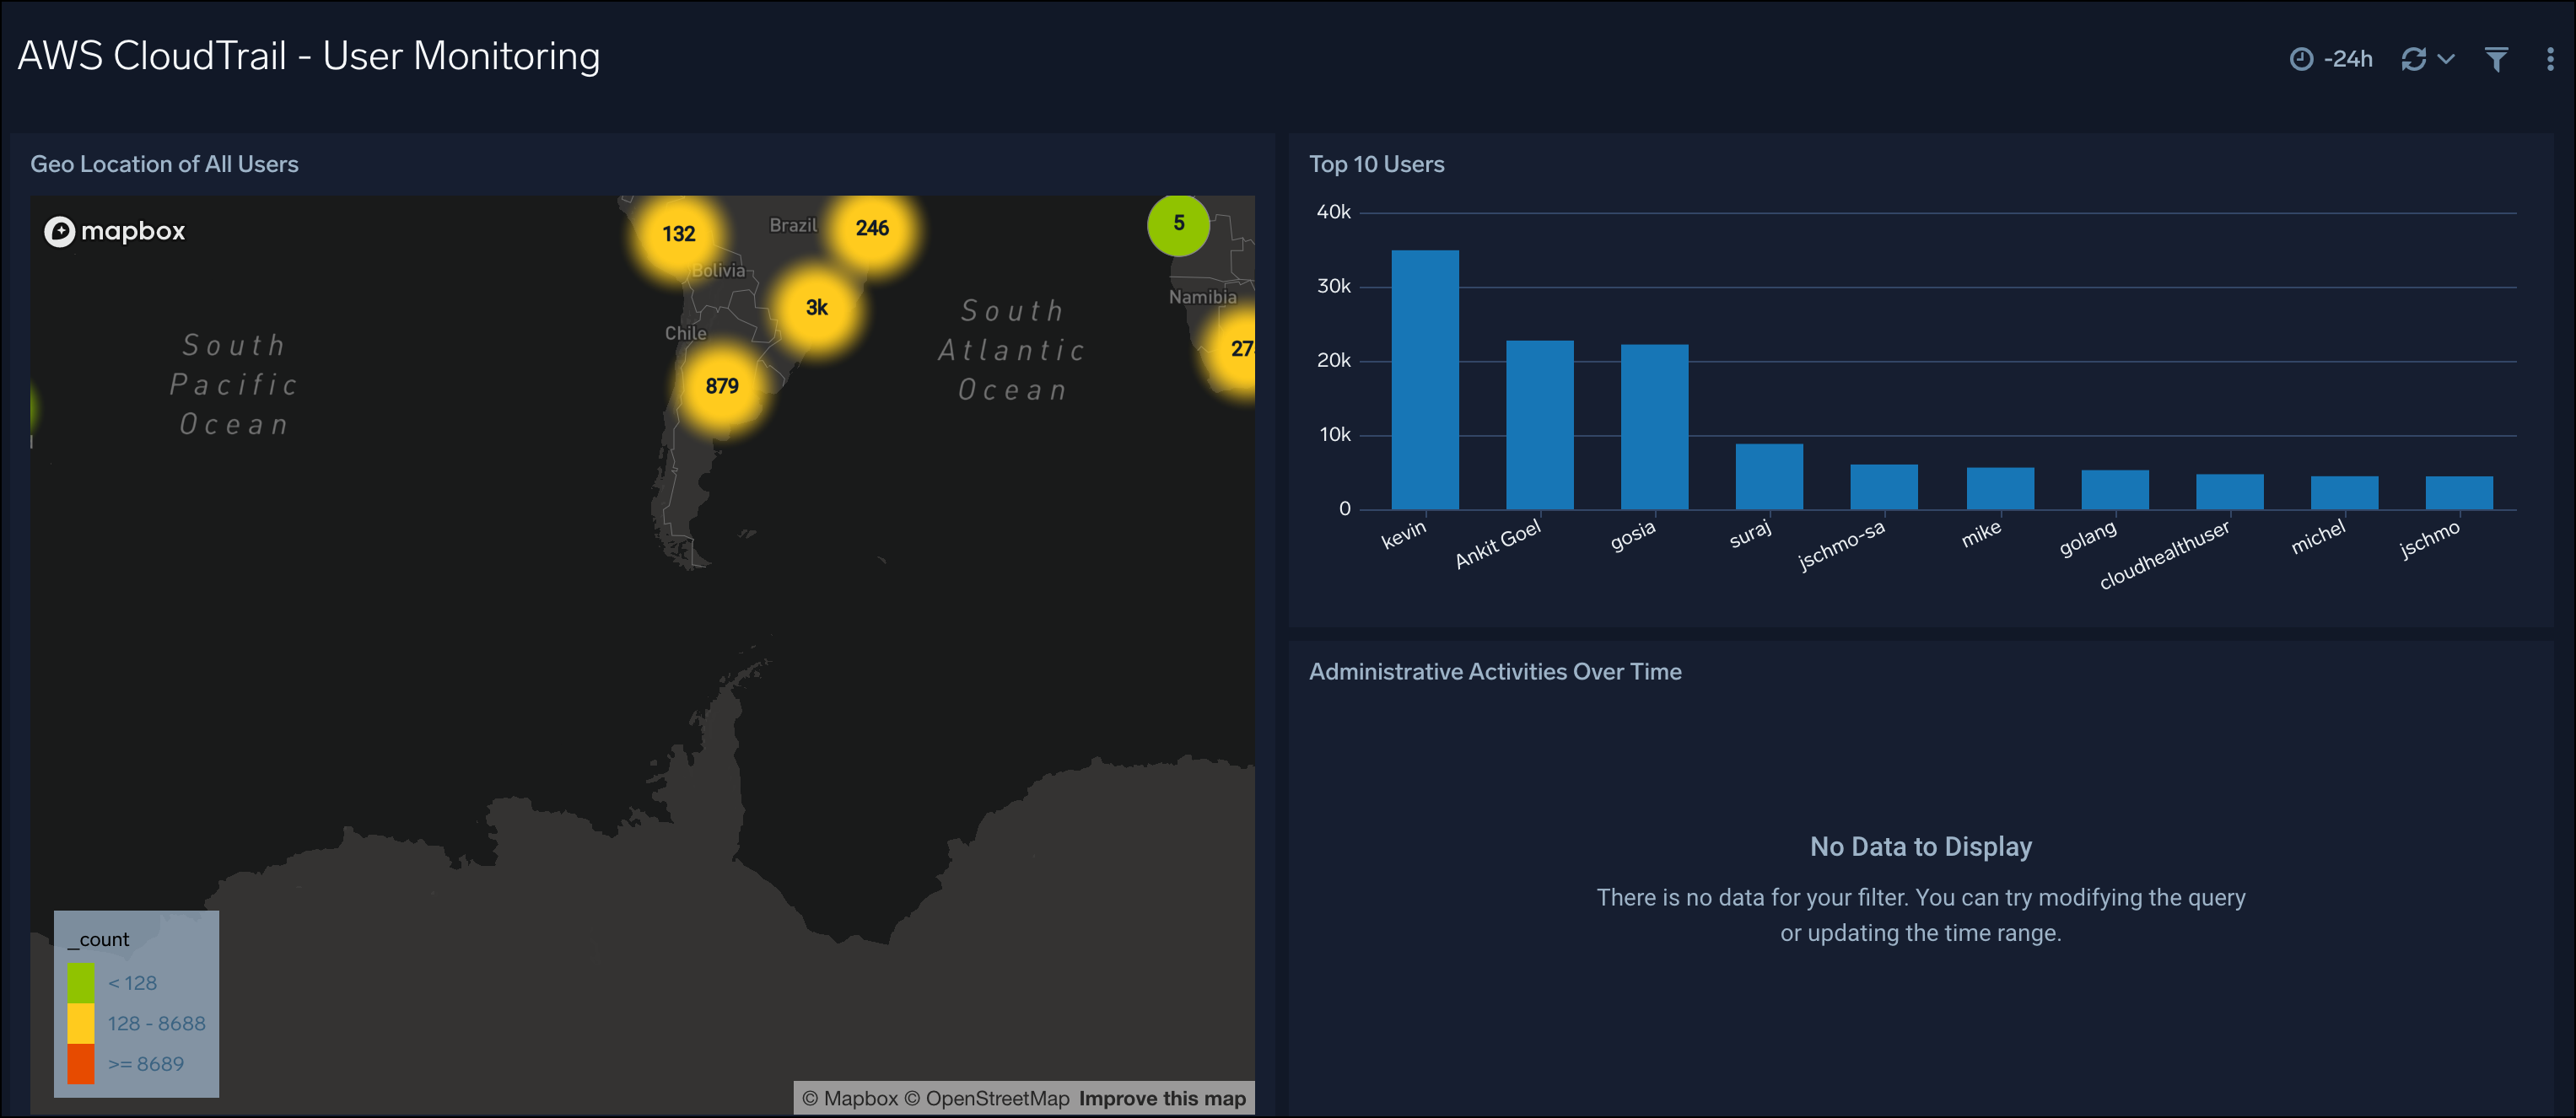
Geo Location of All Users. Using a geolocation search, shows the locations of the IPs used by visitors on a map of the world for the last 24 hours.
Administrative Activities Over Time. Shows which administrative users have been active every hour in a stacked column chart over the past 24 hours.
Top 10 Activities by Administrative Users. See which activities have been performed the most by administrative users in a bar chart for the last 24 hours.
Top 10 Users. This panel displays the top 10 most active AWS users in a column chart for the last 24 hours.
Launched and Terminated Instances by User. Shows the number of instances that have either been launched or terminated every hour over the past 24 hours in a stacked column chart.
Recent Activity by Administrative Users. Activity over the last three hours are displayed by the name of the event (CreateUser, PutUserPolicy, and so on) and by the user’s name and location.
AWS CloudTrail - Network and Security​
See information about network and security events, authorization failures, security group and network ACL changes, and short lived critical operations.
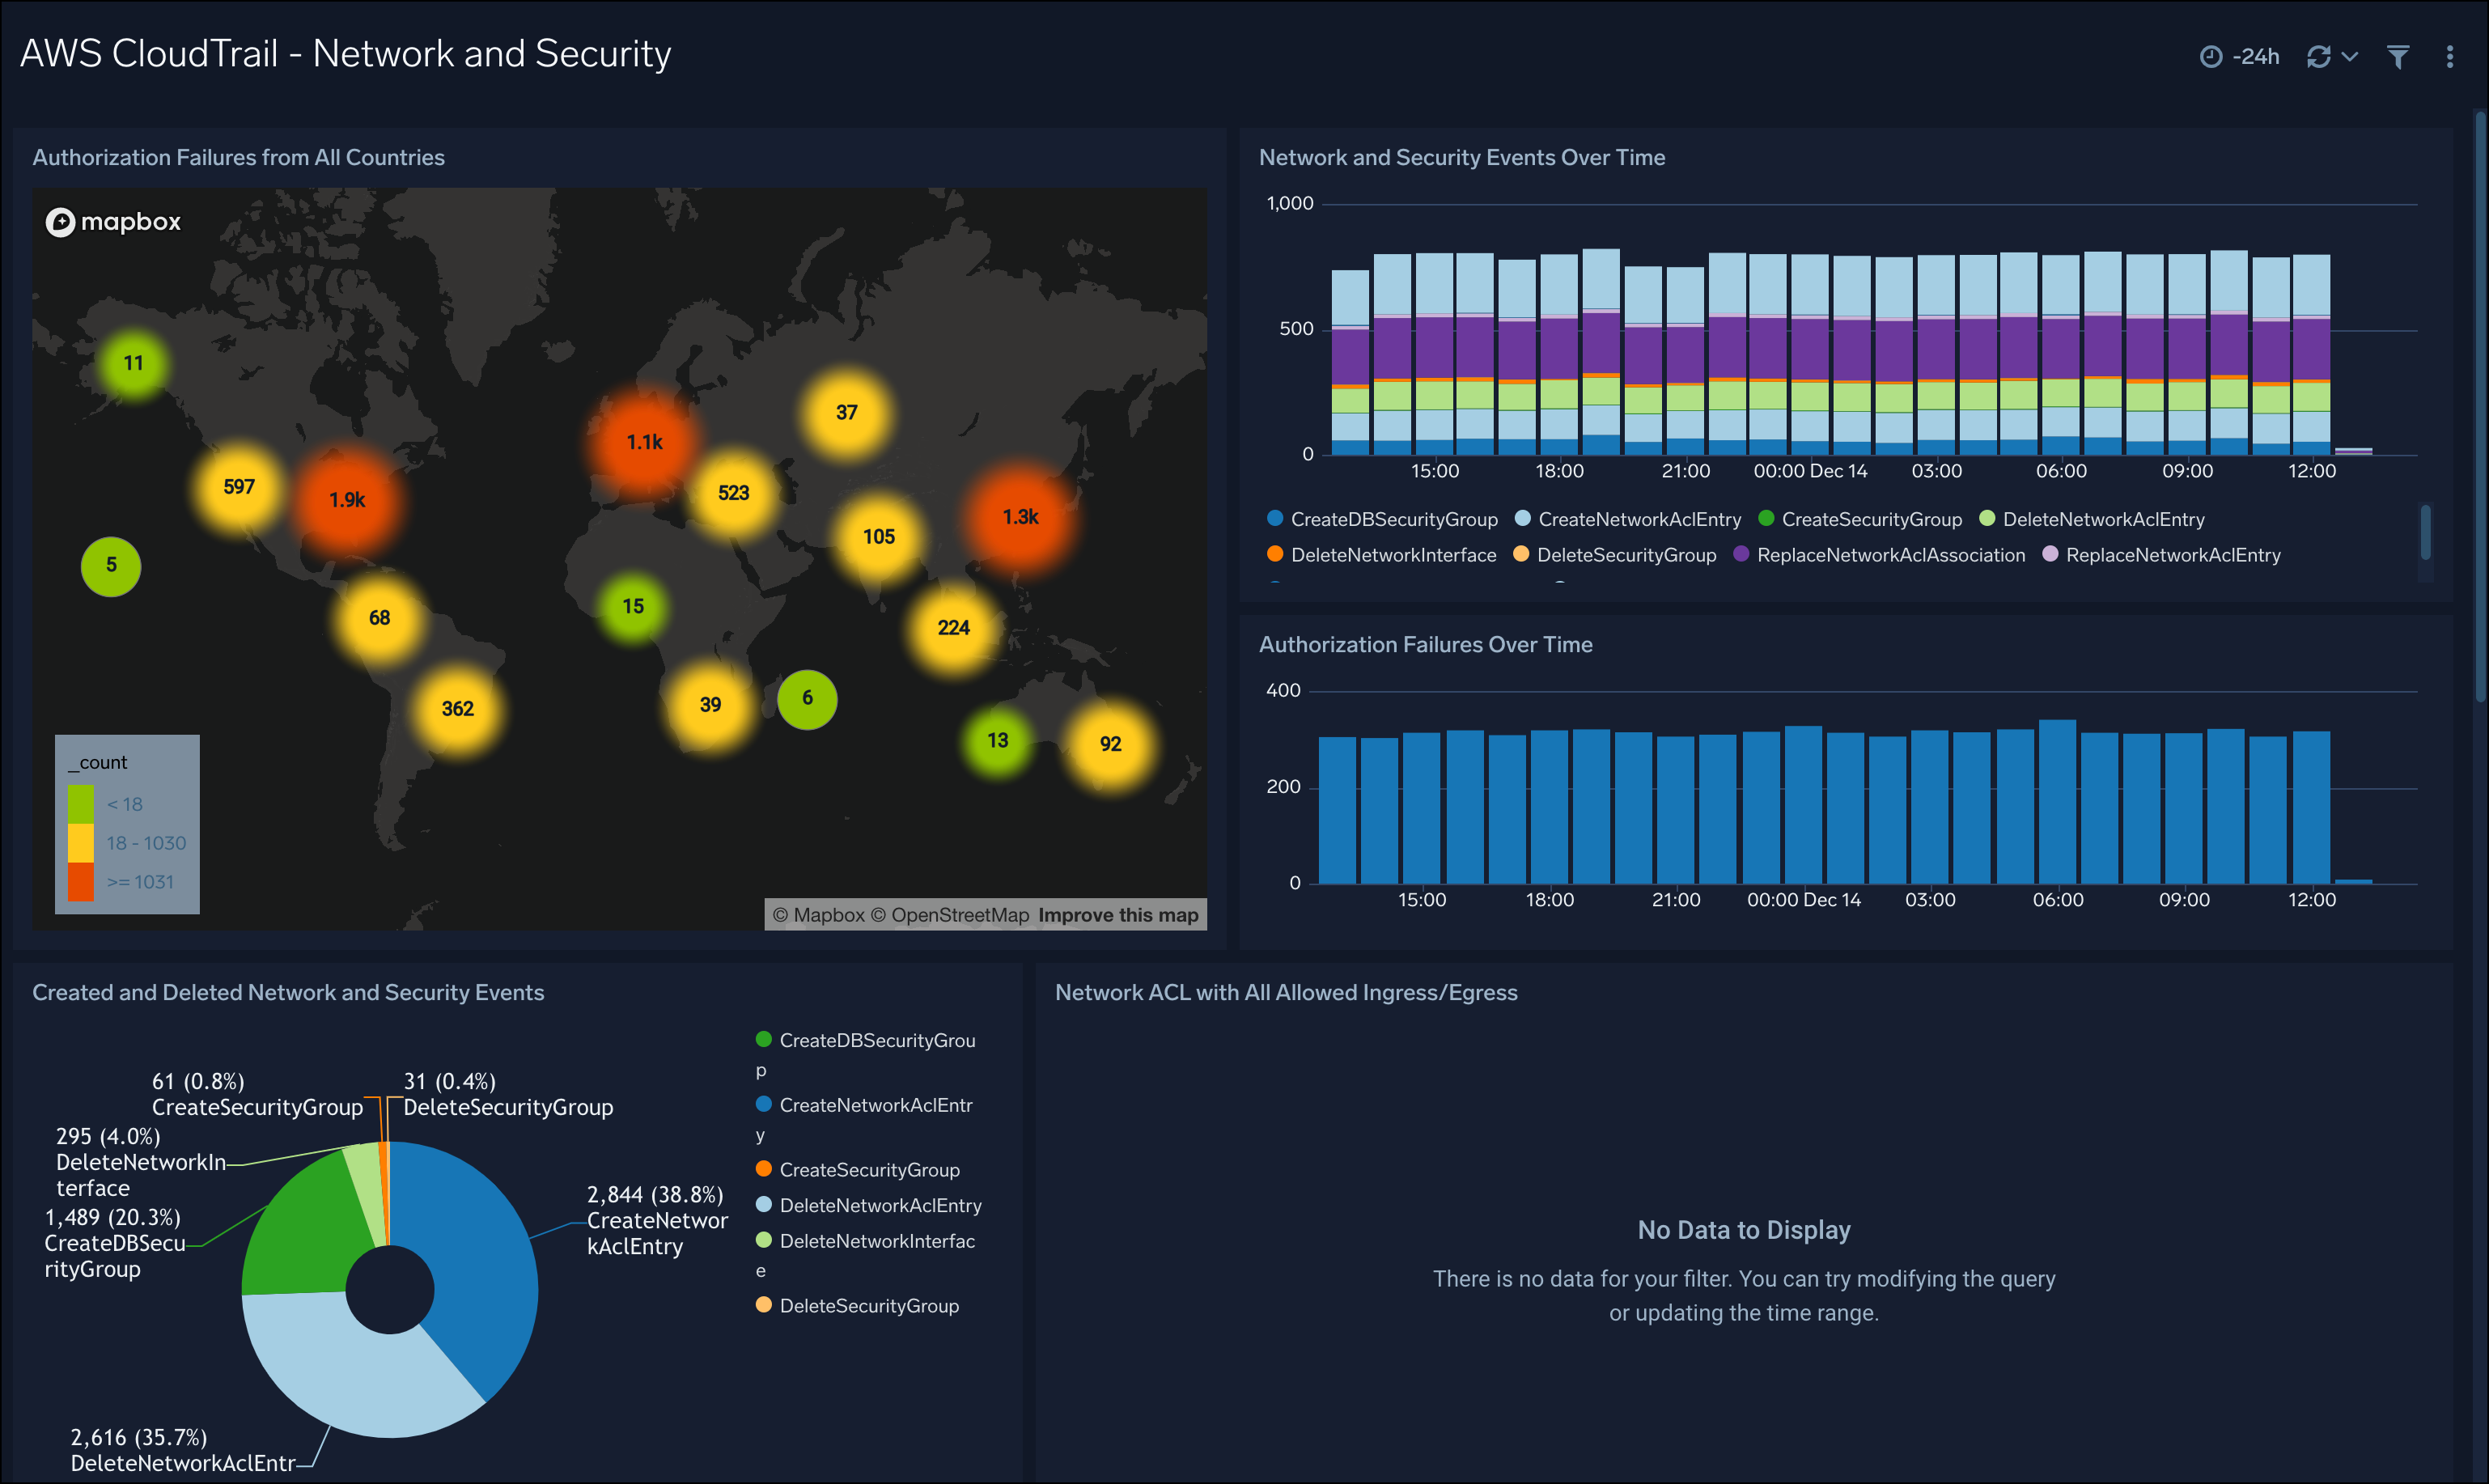
Authorization Failures from All Countries. Uses a geolocation search to display a map of where failures occur world-wide.
Recent Authorization Failures. Shows the most recent authorization failures.
Authorization Failures Over Time. View the number of “Access Denied� errors generated every hour over the past 24 hours.
Network and Security Events Over Time. Displays the number of specific events every hour over the past 24 hours.
Recent Security Group and Network ACL Changes. Shows the most recent changes that were made to security groups in the form of authorizing ingress to a security group or the creation of a network access control list over the past three hours.
Network ACL with All Allowed Ingress/Egress. Displays a list all of inbound or outbound events where ingress or egress for a particular subnet was allowed for all possible ports.
Created and Deleted Network and Security Events. Displays a chart of created or deleted events.
Short Lived Critical Operations. The search behind this Panel watches for users, groups, or policies that are created and then deleted within a span of 10 minutes.
AWS CloudTrail - Operations​
See information about operations activity in your AWS account, including action events, requested AWS services, events by AWS region, created and deleted resources, and elastic IP address operations.
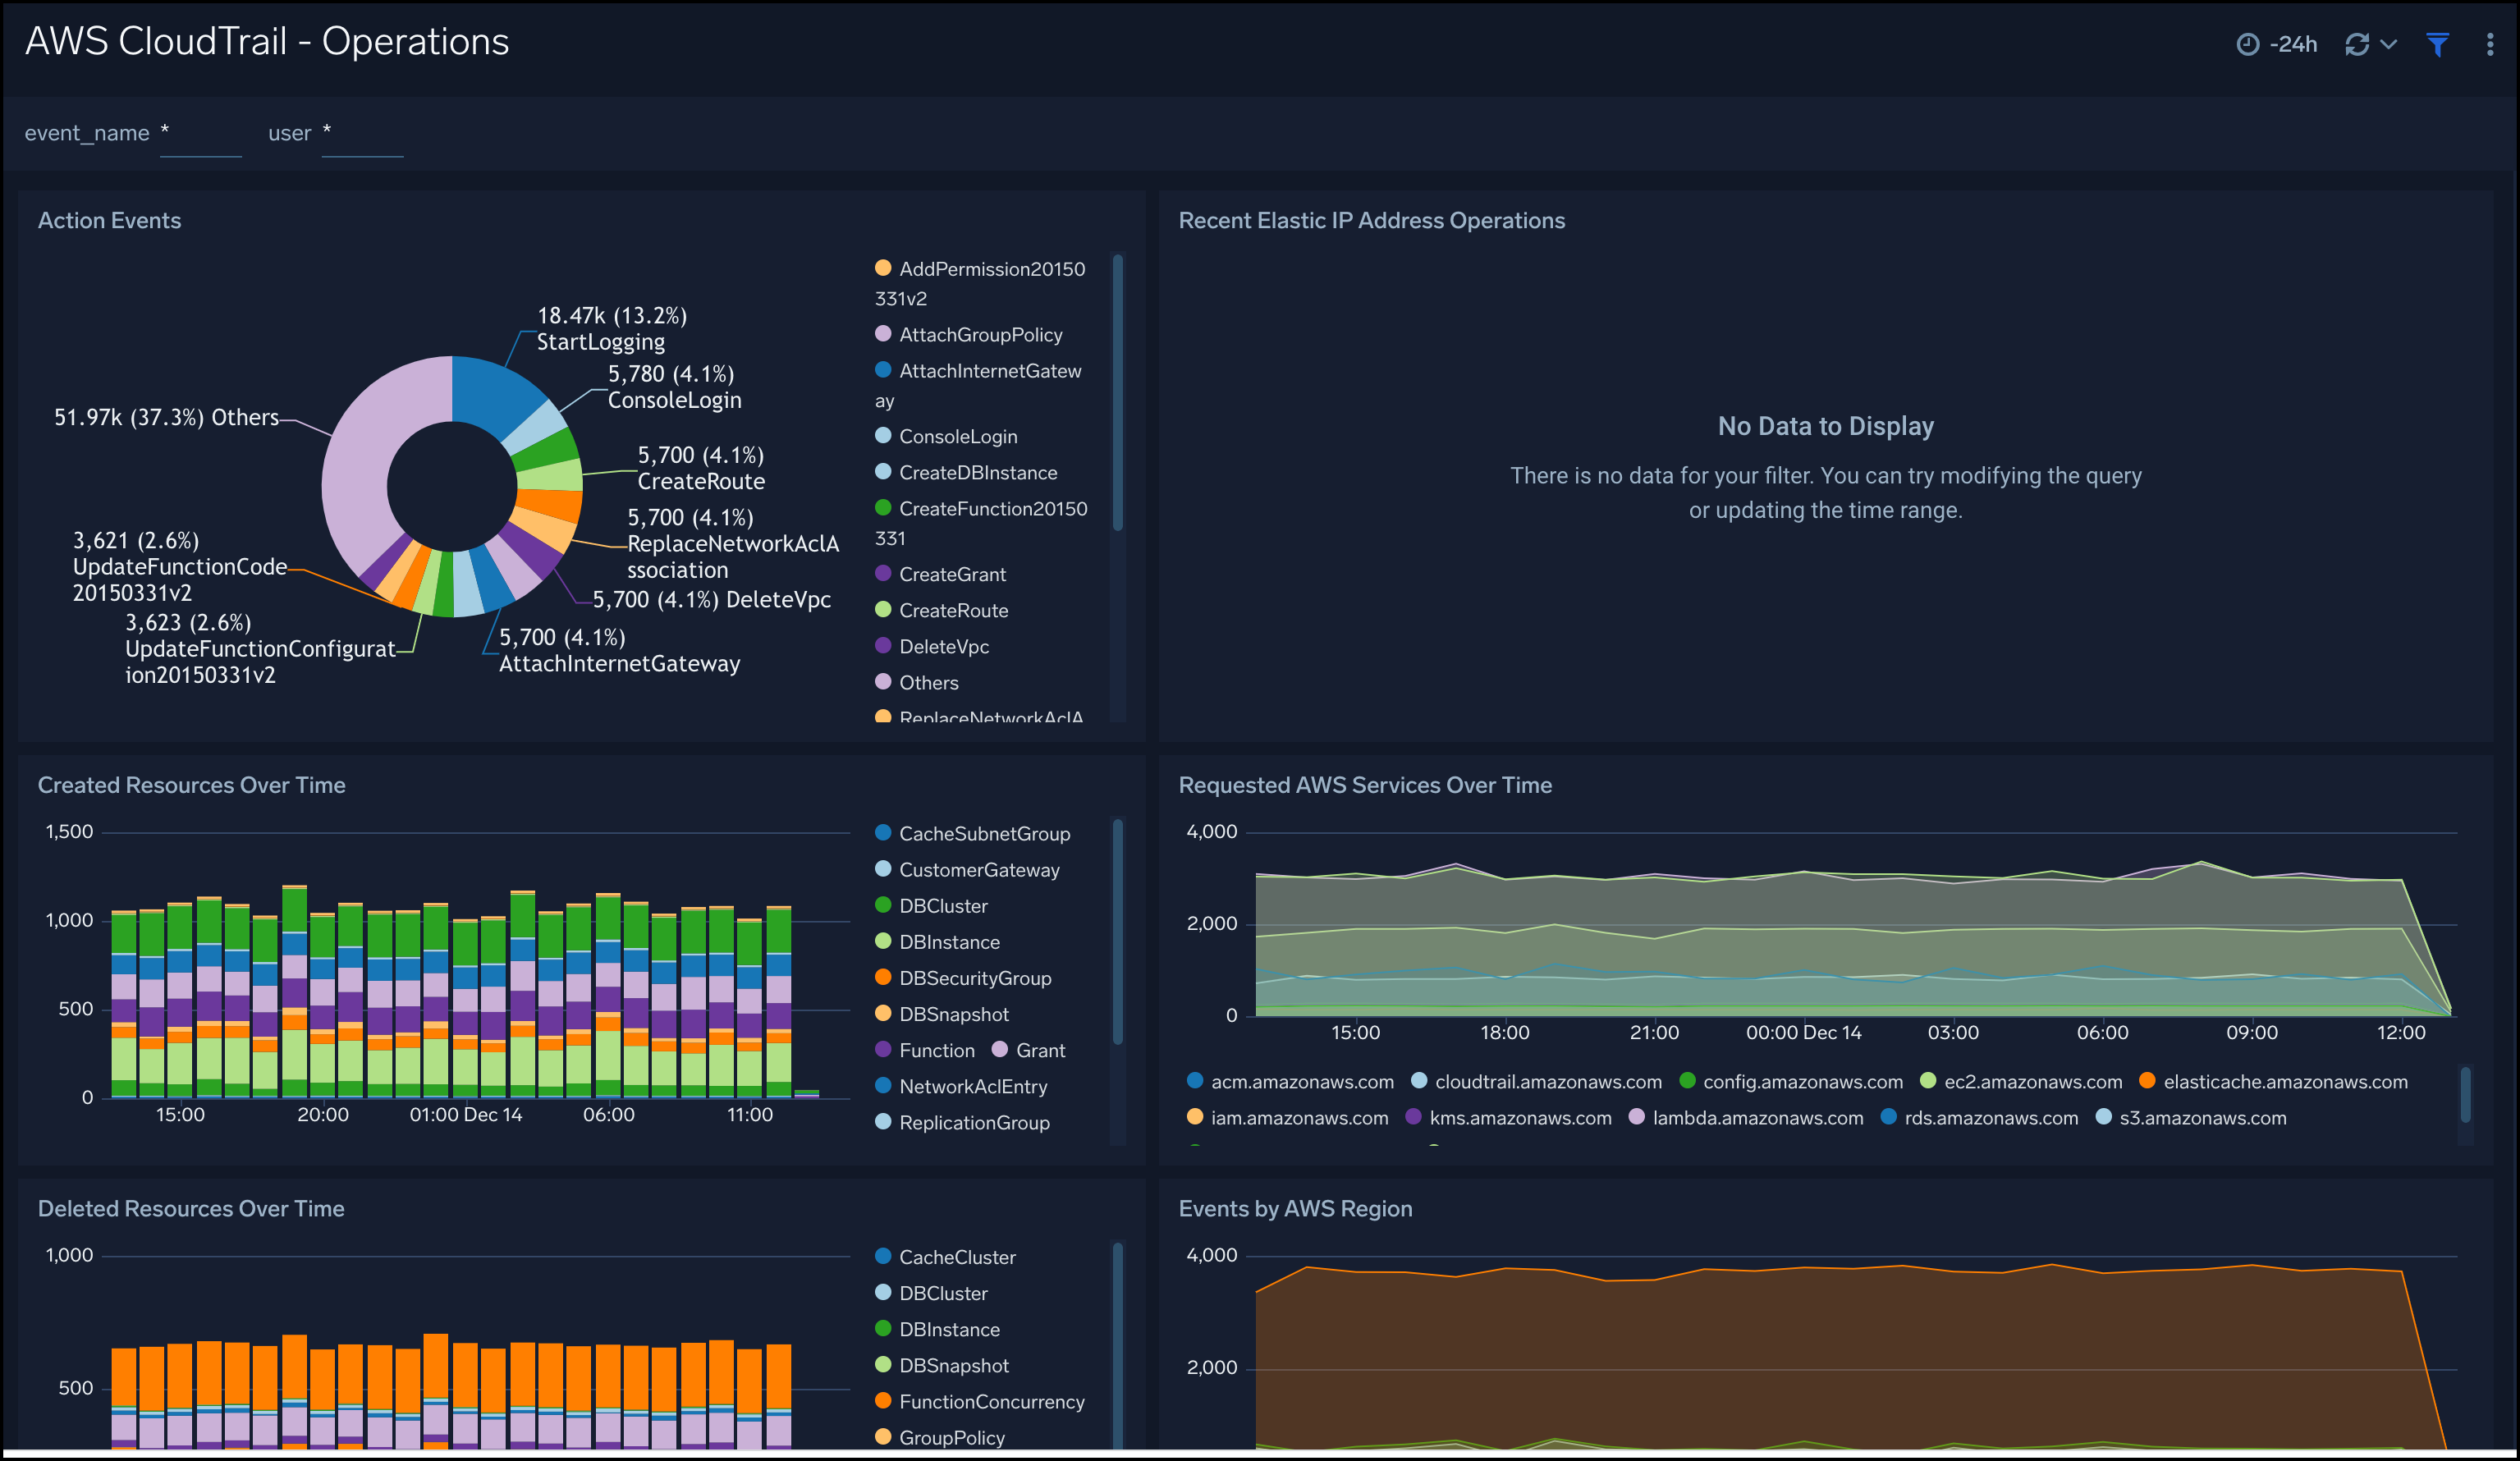
Action Events. Displays a list of events that correspond to a user performing a certain AWS action over the past hour.
Requested AWS Services Over Time. Shows the number of requests every hour over the past 24 hours for AWS services, like EC2 and IAM.
Events by AWS Region. Makes it easy to watch the number of events in each AWS region every hour over the past 24 hours.
Recent Elastic IP Address Operations. View the most recent operations (from the past three hours), displayed by IP address, user, and AWS region.
Created Resources Over Time. Displays a day’s worth of created resources every hour across your deployment.
Deleted Resources Over Time. Displays the resources deleted every hour over the past 24 hours.
AWS CloudTrail - Console Logins​
See information about CloudTrail console logins, including location of users, login events by user, logins from multiple IP address, logins from outside the US, and logins without multi-factor authentication.
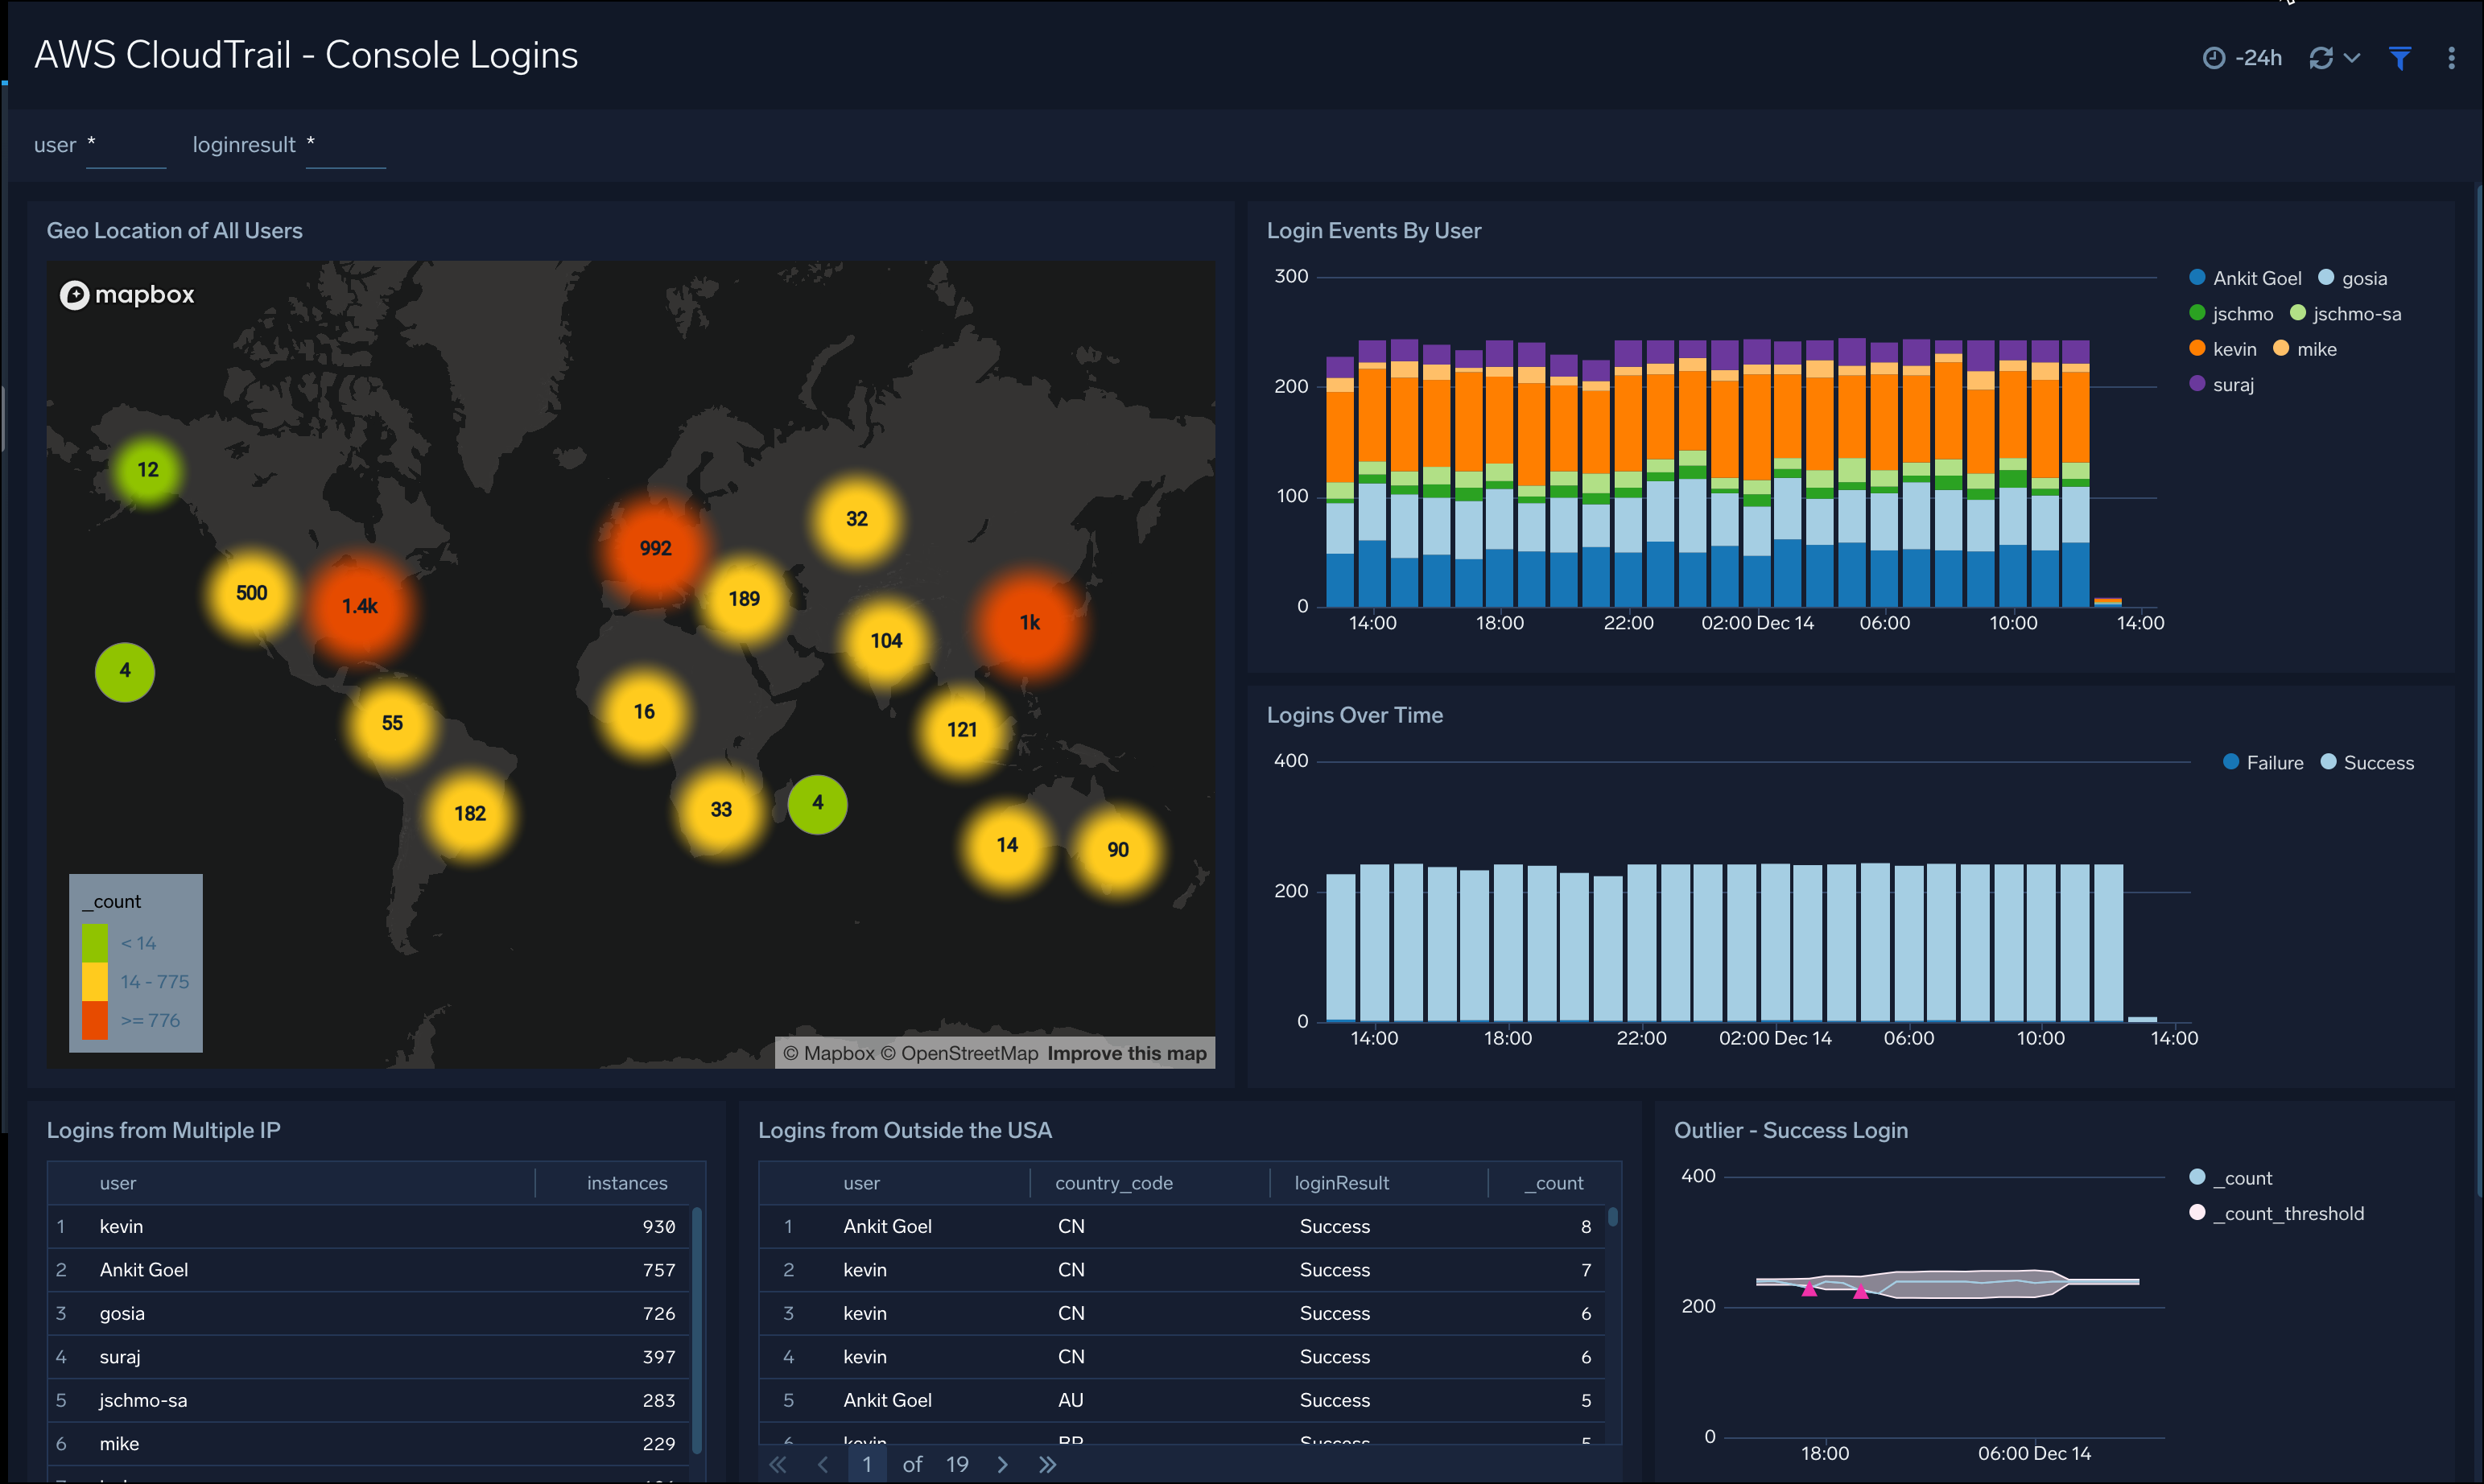
Geo Location of All Users. Uses a geo lookup operation to display the locations of all users by IP address on a map of the world for the last 24 hours.
Login Events By User. Displays login success and failure events per user on a timeline using the timeslices of one hour as a stacked column chart for the last 24 hours.
Logins Over Time. Shows login success and failure events on a timeline using the timeslices of one hour as a line chart for the last 24 hours.
Logins from Multiple IP. Provides information on logins from multiple IP addresses in an aggregation table, including the user name and number of instances for the last 24 hours.
Logins from Outside the USA. Displays logins from locations outside the United States as an aggregation table, including the user name, country code, login result status, and count for the last 24 hours.
Outlier - Success Login. Shows outliers in count of successful logins on a line chart with threshold for the last 24 hours.
Login Results - One Day Time Compare. Shows the number of login successes and failures in an aggregation table, that compares the current count with the count from one day ago.
Outlier - Failed Login. Shows outliers in count of failed login attempts on a line chart with threshold for the last 24 hours.
Logins without MFA. Shows users who have logged in without using multi-factor authentication (MFA) in an aggregation table, including the user name, login result status, and count for the last 24 hours.
AWS CloudTrail - S3 Public Objects and Buckets​
See information about S3 public objects and buckets, including counts of new public objects, public buckets, and modified public objects.
New Public Objects. Shows a count of new public objects for the last 24 hours.
New Public Objects by Object-Bucket. Displays new public objects per object on a timeline using the timeslices of one hour as a stacked column chart for the last 24 hours.
New Public Objects Table. Displays a table with new public objects in your S3 bucket, with time, key, bucket name, account ID, region, username, and access key ID for the last 24 hours.
Public Buckets. Shows a count of public buckets for the last 24 hours.
Public Buckets. Displays public buckets on a timeline using the timeslices of one hour as a stacked column chart for the last 24 hours.
Public Buckets Table. Displays a table with public buckets in your S3 bucket, with time, key, bucket name, account ID, region, username, and access key ID for the last 24 hours.
Modified Public Objects. Shows a count of public objects that have been modified in the last 24 hours.
Modified Public Objects-Bucket. Displays modified public objects per object on a timeline using the timeslices of one hour as a stacked column chart for the last 24 hours.
Modified Public Objects Table. Displays a table with modified public objects in your S3 bucket, with time, key, bucket name, account ID, region, username, and access key ID for the last 24 hours.