AWS Elastic Load Balancing

Amazon Web Services (AWS) Elastic Load Balancing distributes incoming application traffic across multiple Amazon EC2 instances in the AWS Cloud. The Sumo Logic App for Elastic Load Balancing ingests logs generated by this activity, providing greater visibility into events that, in turn, help you understand the overall health of your EC2 deployment. For example, you can use the Sumo Logic App to analyze raw Elastic Load Balancing data to investigate the availability of applications running behind Elastic Load Balancers. Or, by correlating Elastic Load Balancing data with other data sets, you can get a broader understanding of the fault tolerance of your applications across multiple AWS Availability Zones.
For information on unified logs and metrics for AWS Elastic Load Balancing App, see the AWS Elastic Load Balancing ULM Application.
If you are just beginning with AWS ELB, for background see the Sumo Logic DevOps blog, AWS Elastic Load Balancing: Load Balancer Best Practices.
Log types
ELB logs are stored as .log files in the buckets you specify when you enable logging. The process to enable collection for these logs is described in AWS ELB Enable Access Logs. The logs themselves contain these fields in this order:
datetime, ELB_Server, clientIP, port, backend, backend_port, requestProc, ba_Response, cli_Response, ELB_StatusCode, be_StatusCode, rcvd, send, method, protocol, domain, server_port, path
For information on unified logs and metrics for AWS Elastic Load Balancing App, see the AWS Elastic Load Balancing ULM Application.
Sample log messages
2017-01-20T23:00:26.059475Z elb-shop-com 10.15.120.181:80 10.34.7.122:80 0.000026
0.315185 0.000027 200 200 51 1230 "POST https://examplesite.com:443/Common/path HTTP/1.1"
"Mozilla/5.0 (Safari; Touch) AppleWebKit/537.35+ (HTML, like Gecko) Version/10.3.2.2239
Mobile Safari/517.35+"
Sample queries
_sourceCategory=elb*
| parse "* * *:* *:* * * * * * * * \"* *://*:*/* HTTP" as f1, elb_server, clientIP, port, backend, backend_port, requestProc, ba_Response, cli_Response, ELB_StatusCode, be_StatusCode, rcvd, send, method, protocol, domain, server_port, path nodrop
| parse "* * *:* *:* * * * * * * * \"-" as f1,elb_server,clientIP,port,backend,backend_port,requestProc,ba_Response,cli_Response,ELB_StatusCode,be_StatusCode,rcvd,send
| lookup latitude, longitude, country_code, country_name, region, city, postal_code, area_code, metro_code from geo://default on ip = clientIP
| count by latitude, longitude, country_code, country_name, region, city, postal_code, area_code, metro_code
| sort _count
Collecting logs for the AWS Elastic Load Balancing App
This procedure documents how to enable access to your Amazon Web Services (AWS) Elastic Load Balancing (ELB) logs and ingest them into Sumo Logic.
Once you begin uploading data, your daily data usage will increase. It's a good idea to check the Account page in Sumo Logic to make sure that you have enough quota to accommodate additional data in your account. If you need additional quota you can upgrade your account at any time.
Prerequisites
- Enable Elastic Load Balancing logging in your AWS account, using these Sumo Logic instructions. For more information, see AWS ELB documentation. Logging is not enabled in AWS ELB by default.
- Grant access to an IAM user by following these Sumo Logic instructions.
- Confirm that logs are being delivered to the Amazon S3 bucket.
To enable logging in AWS:
- In the AWS Management Console, choose EC2 > Load Balancers.
- Under Access Logs, click Edit.
- In the Configure Access Logs dialog box, click Enable Access Logs, then choose an Interval and S3 bucket. This is the S3 bucket that will upload logs to Sumo Logic.
- Click Save.
If you have more than one environment that generates Elastic Load Balancing data (such as ops, dev, and so on) you’ll need to configure a separate S3 Source for each environment. This means that you’ll have the three App Dashboards for each environment. To avoid confusion, and in order to identify which environment is generating data, you should name each S3 Source with the environment's name. For example, you might name Sources as ELB-prod, ELB-dev, ELB-test, and so on.
Finally, make copies of each Panel in the Elastic Load Balancing Dashboards, and modify the search logic in each Panel so that you select the appropriate source for each environment. For example, for a production environment, you will add the string: _source=ELB-production to the beginning of each search. If you have three environments then you will have three copies of the application for each of them (nine dashboards in total).
Configure a Collector
Configure a Hosted Collector.
Configure a Source
Configure an AWS Elastic Load Balancing Source, which includes specifying the following:
- Source fields:
- Bucket Name. (Required) ELB, for example.
- Path Expression. For example,
my-bucket/prefix/AWSLogs/123456789012/*.log - Source Category. (Required) ELB_Prod, for example. For details, see Best Practices.
- Advanced:
- Enable Timestamp Parsing. True
- Time Zone. Logs are in UTC by default
- Timestamp Format. Auto Detect
Field Extraction Rules
For Field Extraction Rules, use the source category established earlier.
parse "* * *:* *:* * * * * * * * \"* *://*:*/* HTTP" as datetime, ELB_Server, clientIP, port, backend, backend_port, requestProc, ba_Response, cli_Response, ELB_StatusCode, be_StatusCode, rcvd, send, method, protocol, domain, server_port, path
Installing the AWS ELB App
Now that you have set up collection for AWS ELB, install the Sumo Logic App for AWS Elastic Load Balancing to use the preconfigured searches and dashboards to analyze your data.
To install the app:
- Select App Catalog.
- In the 🔎 Search Apps field, run a search for your desired app, then select it.
- Click Install App.
note
Sometimes this button says Add Integration.
- On the next configuration page, under Select Data Source for your App, complete the following fields:
- Data Source. Select one of the following options:
- Choose Source Category and select a source category from the list; or
- Choose Enter a Custom Data Filter, and enter a custom source category beginning with an underscore. For example,
_sourceCategory=MyCategory.
- Folder Name. You can retain the existing name or enter a custom name of your choice for the app.
- All Folders (optional). The default location is the Personal folder in your Library. If desired, you can choose a different location and/or click New Folder to add it to a new folder.
- Data Source. Select one of the following options:
- Click Next.
- Look for the dialog confirming that your app was installed successfully.

Post-installation
Once your app is installed, it will appear in your Personal folder or the folder that you specified. From here, you can share it with other users in your organization. Dashboard panels will automatically start to fill with data matching the time range query received since you created the panel. Results won't be available immediately, but within about 20 minutes, you'll see completed graphs and maps.
What if data isn't displaying in all Panels?
Amazon S3 buckets are scanned for new files according to the Scan Interval you set when configuring the S3 Source used for AWS Elastic Load Balancing logs. Even if you set a shorter Scan Interval, say five minutes, if no new files are found, the Scan Interval is automatically doubled, up to 24 hours (you can read more in Set the S3 Source Scan Interval). If the Scan Interval increases, it means that a Panel set to a 60-minute time range may not find any data to display, because no files have uploaded to Sumo Logic. This isn't to say that no data is being collected from your S3 bucket; you can confirm that data is being collected on the Status page.
Additionally, you can change the time range of a Panel. Even though these Panels have been preconfigured, they can be edited just like any other Panel. You'll find instructions in Changing the time range of a Panel.
Viewing AWS ELB Dashboards
The Sumo Logic App for AWS Elastic Load Balancing helps you monitor the overall health of your ELB deployment. Dashboards keep an eye on errors being generated by back-end applications as well as errors generated from ELB instances.
Overview

Requests by Geolocation. Uses a geolocation query to display a map of the IP addresses used by clients accessing your apps for the last three hours.
Requests and Data Volume. Displays the data being sent and received by client IP in a pie chart for the last three hours.
Requests by Load Balancer. Displays a bar chart of how many requests are hitting a load balancer for the last three hours.
4XX and 5XX Status Codes by Backend Instance and ELB. Charts the number of 4XX and 5XX status codes for each backend instance and ELB in a bar chart over the last 24 hours.
Latency by Load Balancer. Displays the latency of each load balancer in AWS in a stacked column chart for the last three hours.
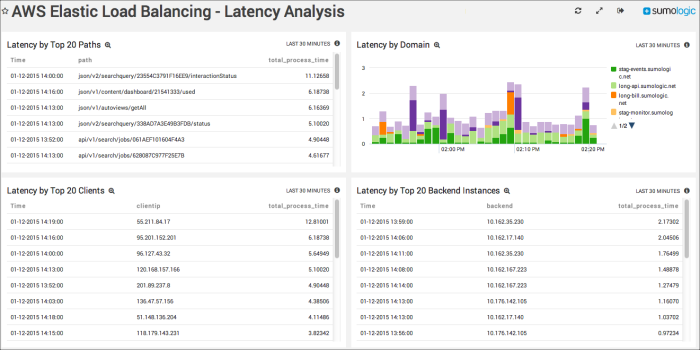
Latency Analysis

Latency by Top 20 Paths. Displays the process time of the busiest 20 paths in your deployment.
Latency by Top 20 Clients. Displays the process time of the top 20 IP addresses in your deployment.
Latency by Domain. Displays the latency of each domain in your EC2 deployment.
Latency by Top 20 Backend Instances. This Panel focuses solely on the back end of your AWS EC2 deployment, keeping watch over the processing time of the 20 busiest instances.
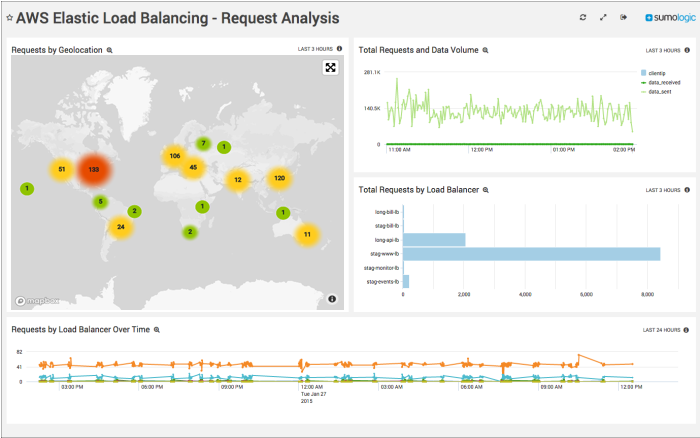
Requests Analysis

Requests by Geolocation. Uses a geolocation query to display a map of the IP addresses used by clients accessing your apps for the last three hours.
Total Requests and Data Volume. Displays the data being sent and received by client IP in a line chart on a timeline for the last three hours.
Total Requests by Load Balancer. Show the requests per load balancer over time in a bar chart for the last three hours.
Requests by Load Balancer Over Time. Displays a line chart of how many requests are hitting a load balancer on a timeline over the last 24 hours.
Status Codes Analysis

Backend Instance and Load Balancer 4XX Status Codes by Path. Displays the time an error occurred, along with the associated path.
Backend Instance and Load Balancer 4XX Status Codes by Domain. Displays the time of an error, along with the domain, the load balancer associated with the domain, and the error code.
Backend Instance and Load Balancer 4XX Status Codes by Client. Shows the time an error occurred, the IP that generated the error, the load balancer associated with the UP, and the number of errors that have occurred.
Backend Instance and Load Balancer 5XX Status Codes by Path. Shows the time error(s) occurred on a specific path, along with the load balancer and backed instance associated with the path.
Backend Instance and Load Balancer 5XX Status Codes by Domain. Shows the time error(s) occurred in a domain, along with the load balancer and backed instance associated with domain.
Backend Instance and Load Balancer 5XX Status Codes by Client. Shows the time error(s) occurred at an IP, along with the load balancer and backed instance associated with the client IP.