HTTP Logs and Metrics Source

An HTTP Logs and Metrics Source is an endpoint for receiving log and metric data uploaded to a unique URL generated for the Source. The URL securely encodes the Collector and Source information. You can add as many HTTP Logs and Metrics Sources as you'd like to a single Hosted Collector.
With an HTTP Logs and Metrics Source you can upload logs and metrics from data sources where you cannot install a Collector. For example, you can export data from a platform as a service (PaaS) or an infrastructure as a service (IaaS) provider, allowing you to gain visibility, for instance, into your billing system service provider, leveraging the same Sumo tools your organization already uses. Check with your IaaS or PaaS providers for information about using their APIs to forward log or metric data to Sumo Logic's HTTP endpoint.
When you set up an HTTP Logs and Metrics Source, a unique URL is assigned to that source. The generated URL is a long string of letters and numbers. You can generate a new URL at any time. For more information, see Generating a new URL.
Data payload considerations
We recommend that the data payload of a POST request have a size, before compression, of 100KB to 1MB.
As a best practice, Sumo Logic recommends batching data into each POST request to reduce the number of requests being sent over the network. Batching data into a single request minimizes the number requests required to move a given volume of data and reduces resource utilization on the sending machine. You may send batched requests up to but not exceeding 1MB of uncompressed data. However, the optimal batch for a given use case depends on the rate and cadence at which logs or metrics occur in your system.
Configure an HTTP Logs and Metrics Source
To configure an HTTP Logs and Metrics Source:
- Classic UI. In the main Sumo Logic menu, select Manage Data > Collection > Collection.
New UI. In the Sumo Logic top menu select Configuration, and then under Data Collection select Collection. You can also click the Go To... menu at the top of the screen and select Collection. - In the Collectors page, click Add Source next to a Hosted Collector.
- Select HTTP Logs & Metrics.
- Enter a Name to display for the Source in the Sumo web application. Description is optional.
- (Optional) For Source Host and Source Category, enter any string to tag the output collected from the source. (Category metadata is stored in a searchable field called _sourceCategory.)
- SIEM Processing. This option is present if Cloud SIEM is enabled. Click the checkbox to to send the logs collected by the source to Cloud SIEM.
- Fields. Click the +Add Field link to define the fields you want to associate, each field needs a name (key) and value.
A green circle with a check mark is shown when the field exists in the Fields table schema.
An orange triangle with an exclamation point is shown when the field doesn't exist in the Fields table schema. In this case, an option to automatically add the nonexistent fields to the Fields table schema is provided. If a field is sent to Sumo that does not exist in the Fields schema it is ignored, known as dropped.
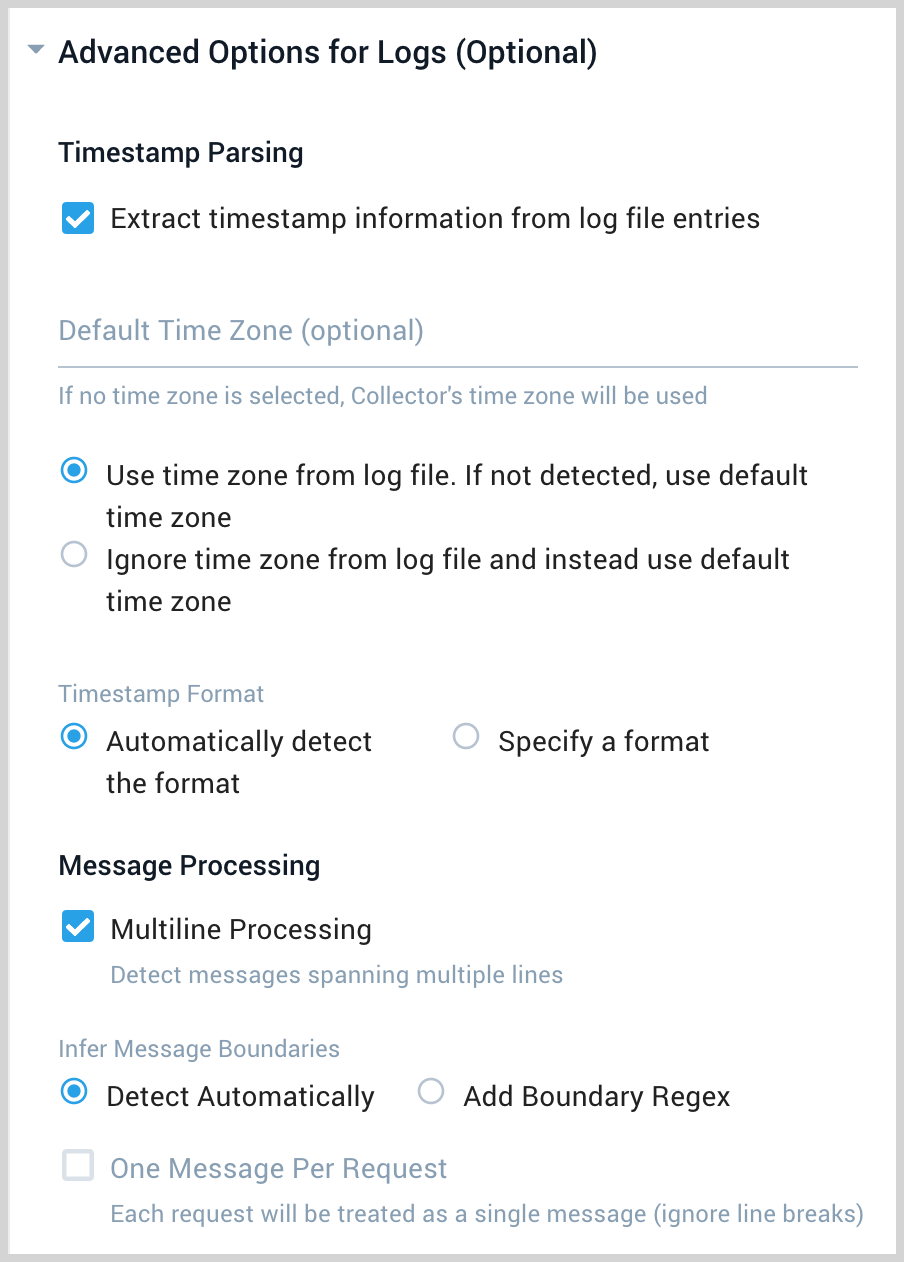
- Advanced Options for Logs. Advanced options do not apply to uploaded metrics.

- Timestamp Parsing. This option is selected by default. If it's deselected, no timestamp information is parsed at all.
- Time Zone. There are two options for Time Zone. You can use the time zone present in your log files, and then choose an option in case time zone information is missing from a log message. Or, you can have Sumo Logic completely disregard any time zone information present in logs by forcing a time zone. It's very important to have the proper time zone set, no matter which option you choose. If the time zone of logs cannot be determined, Sumo Logic assigns logs UTC; if the rest of your logs are from another time zone your search results will be affected.
- Timestamp Format. By default, Sumo Logic will automatically detect the timestamp format of your logs. However, you can manually specify a timestamp format for a Source. See Timestamps, Time Zones, Time Ranges, and Date Formats for more information.
- Multiline Processing. See Collecting Multiline Logs for details on multiline processing and its options. Check this option if you're working with multiline messages (for example, log4J messages or exception stack traces). De-select this option if you want to avoid unnecessary processing when collecting single-message-per-line files such as a Linux
system.log. - Infer Message Boundaries.
- Detect Automatically. By default, the Source is configured to automatically detect which lines belong to the same message.
- Add Boundary Regex. You can provide a Regular Expression to detect the entire first line of multi-line messages. The expression must match the entire first line of each log message within the file.
- One Message Per Request. Select this option if you'll be sending a single message with each HTTP request. For more information, see Multiline options in HTTP sources.
- Timestamp Parsing. This option is selected by default. If it's deselected, no timestamp information is parsed at all.
- Processing Rules. Configure any desired filters, such as allowlist, denylist, hash, or mask, as described in Create a Processing Rule. Processing rules are applied to log data, but not to metric data.
- When you are finished configuring the Source, click Save.
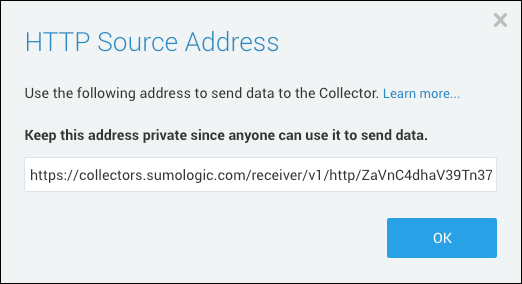
- When the URL associated with the source is displayed, copy the URL so you can use it to upload data.

- Metrics reported with a timestamp older than 24 hours ago or newer than 24 hours in the future from the time they are reported are dropped. Make sure that the Metrics sent to HTTP Endpoint have appropriate timestamps.
- Sumo Logic enforces limits on the volume of metrics and associated metadata you ingest. For more information, see Data Limits for Metrics.
Upload data to the HTTP Logs and Metrics Source
You can upload both logs and supported metric types to an HTTP Source. There are different requirements depending on whether you are uploading logs or metrics to the Source.
HTTP Access Control (CORS)
Sumo Logic HTTP Sources support clients bound by the CORS mechanism.
To ensure the appropriate Access-Control-* response headers are set, make sure the Origin header is populated in the initial OPTIONS probe and all subsequent requests.
Compressed Data
You can send Sumo plain, uncompressed data (such as plain text) or you can send data that has been compressed by either the "deflate" or the "gzip" method. Compressed data can only be sent with the POST method. You can compress log data or metric data prior to upload.
To send a compressed payload, specify a value of gzip (for gzip-compressed) or deflate (for zlib-compressed) in the Content-Encoding header of your request, and include the compressed data as the request body.
Compressed files are decompressed before they are ingested, so they are ingested at the decompressed file size rate.
Access a Source's URL
If you need to access the Source's URL again, click Show URL.

The Source's url can be viewed by sending a GET request to the Collector Management API for the Source's JSON configuration.
Multiline options in HTTP sources
The HTTP Logs and Metrics Source isn't designed to support large numbers of connections per source. If possible, you should batch log messages locally and send batches on a single thread.
To increase throughput, batch multiple log messages in a single request to the Source. If any of those logs can contain multiline messages, like stack traces, activate Enable Multiline Processing.

For basic multiline processing, select Infer Boundaries; if this leads to malformed messages, you can instead specify a regular expression to determine the multiline boundary.
Also, in your HTTP Source configuration, make sure that the check box Enable One Message Per Request is deactivated. This option allows you to specify that all data sent within an individual HTTP request to an HTTP Source endpoint should be considered to be one log message.
Sumo expects that the entire content of an individual log message will be sent to Sumo within the same HTTP request. Multiline processing rules are only applied within the bounds of the data sent within a single HTTP request. This means that a multiline log that is sent to Sumo across multiple HTTP requests will not be detected as a single message. It will be broken into separate log messages. Sumo does not currently have the ability to detect and thread together a distinct log message that has been sent via multiple HTTP requests.
For tools to help you batch messages, see Sumo Logic .NET Appenders.
For details on how the Collector processes multiline logs, see Collecting Multiline Logs.