Do you want to understand your New Relic data better? New Relic Query Language (NRQL) can help. NRQL lets you analyze your data in real time. Although it can seem overwhelming at first glance, worry not. In this two-part blog, we cover 10 essential NRQL functions and clauses that will help you understand NRQL better and gain deeper insights into your data. These functions and clauses can help you calculate percentages, create heatmaps, create conditional widgets, and so much more. By using NRQL, you can get more out of your data analysis. Let's learn how to use NRQL to gain valuable insights from your data.
In part 1 of this blog, we covered the basic NRQL functions necessary for querying data. In part 2, we dive into the more advanced features of NRQL. We cover topics such as histograms, heatmaps, and advanced comparison operators. We explore how to use NRQL to analyze complex data sets and identify patterns and trends in your data. And we look at some best practices for writing efficient queries and optimizing your NRQL queries for performance.
Number 6: Latest
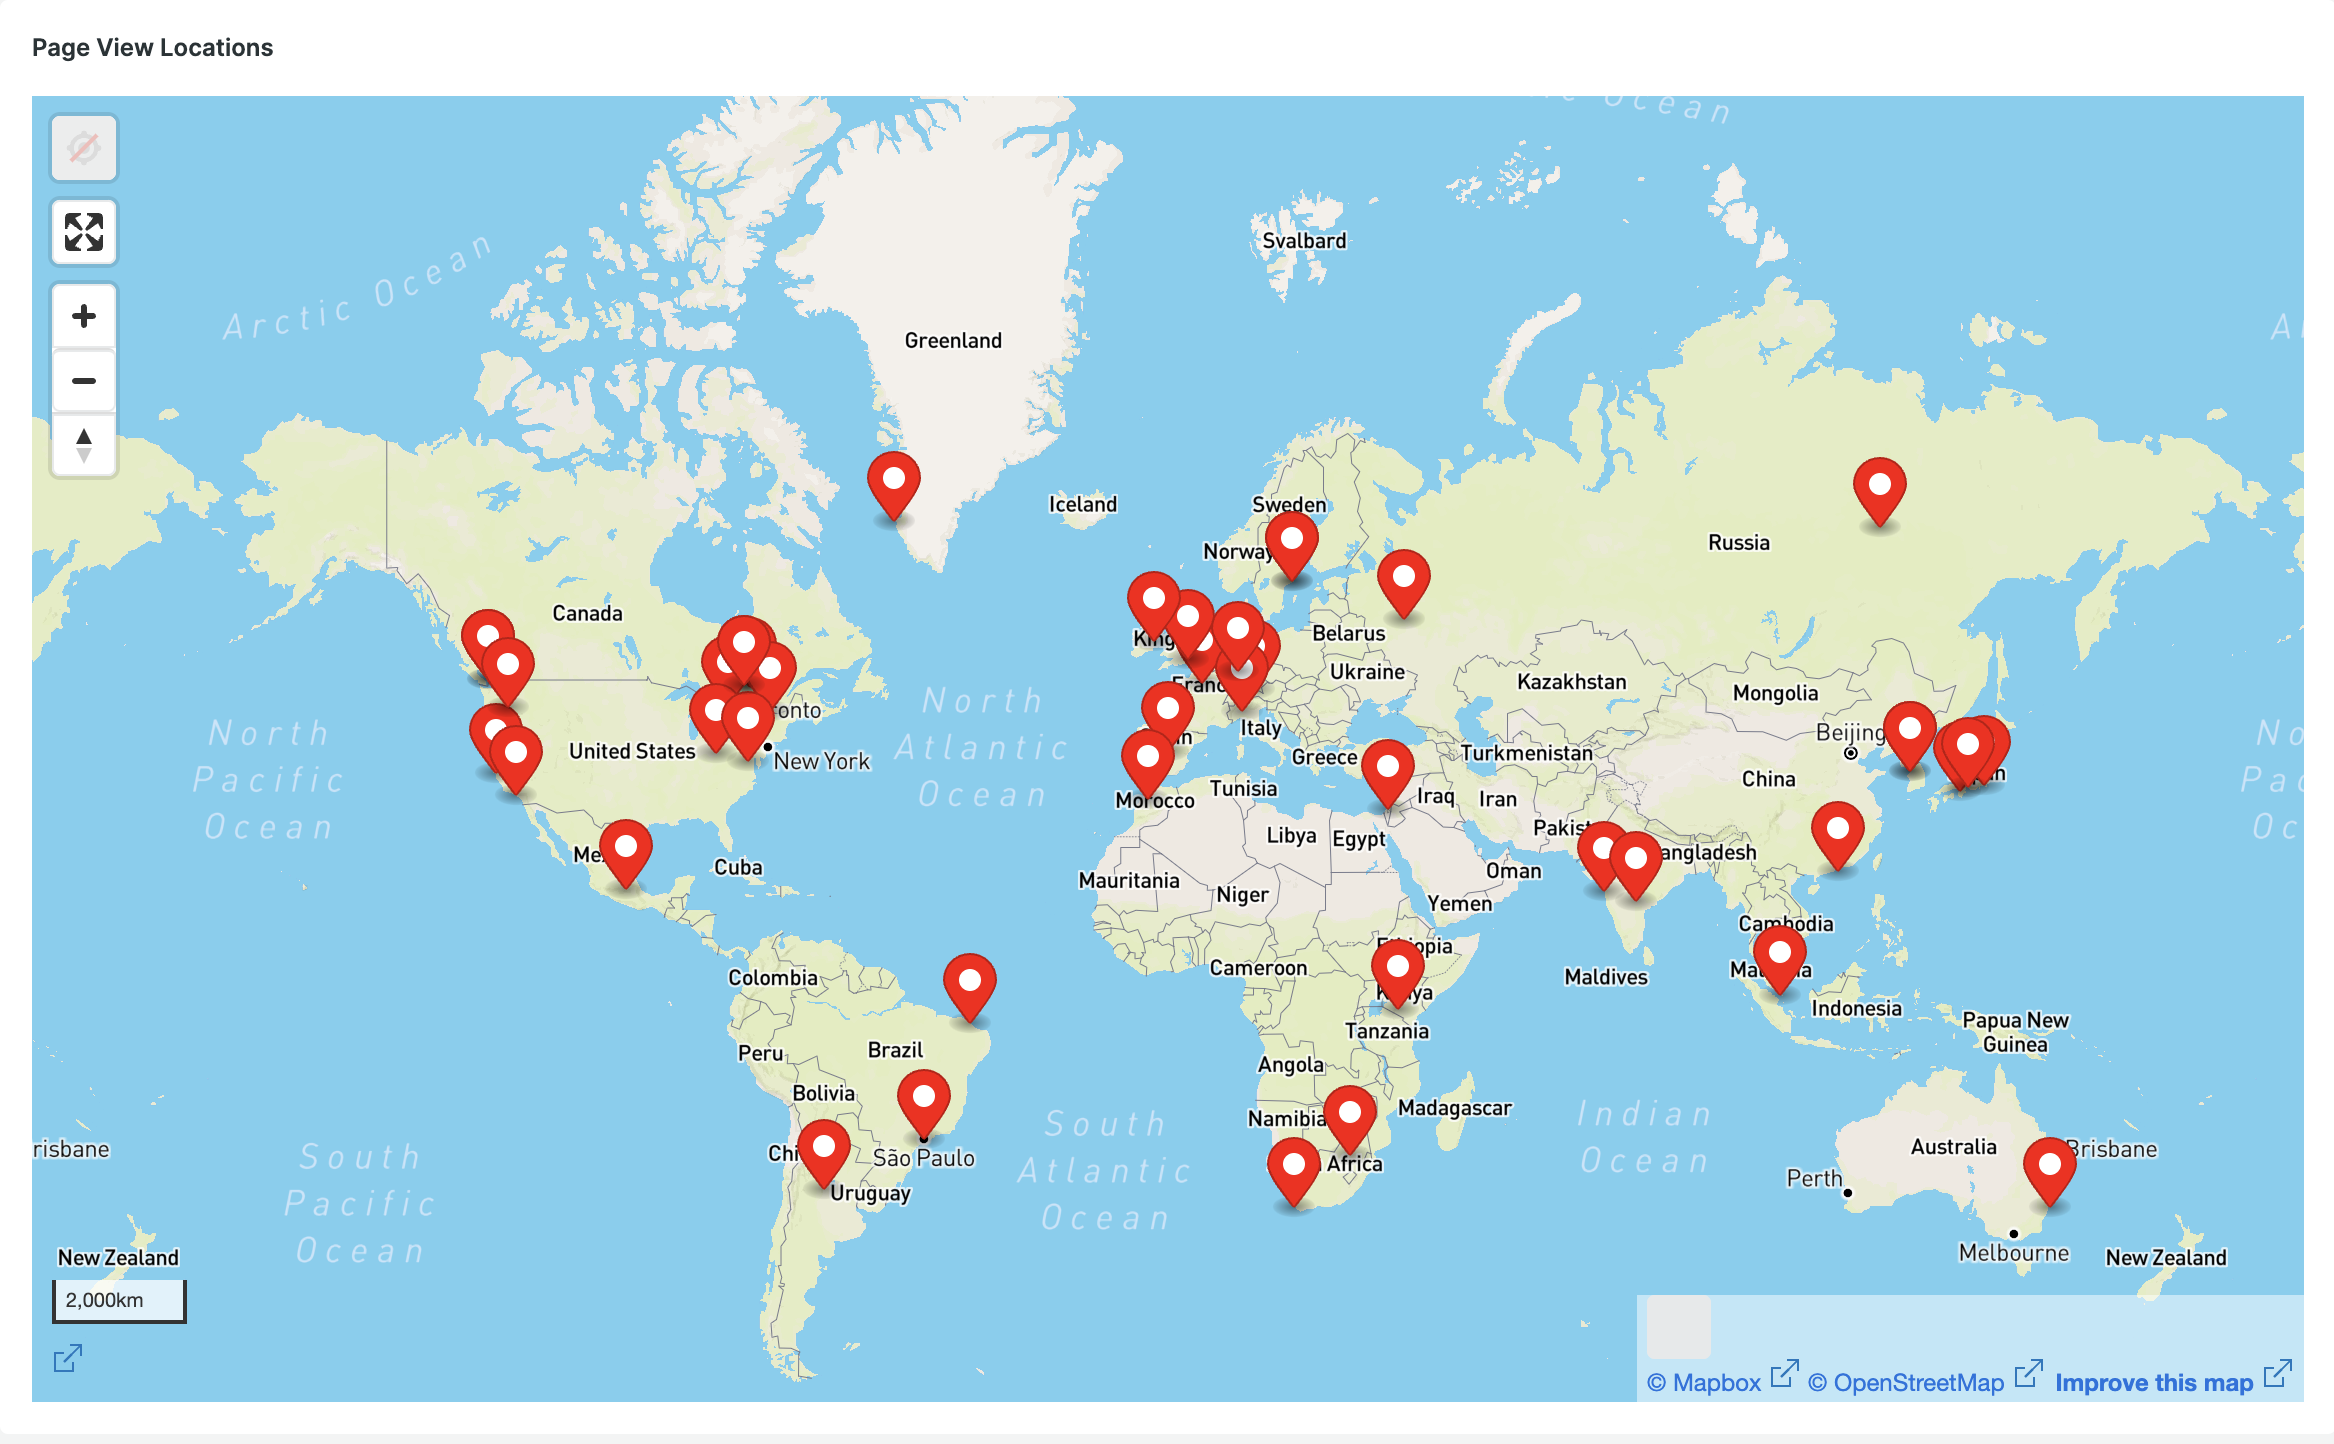
The latest() function allows users to retrieve the most recent value of an attribute over a specified range of time. It can take in a single attribute as an input, and return the most recently recorded value.
Here's a simple example to fetch the most recent value of the attribute city in the map widget from the PageView event:
FROM PageView
SELECT LATEST(city) AS 'Name:City'
FACET STRING(asnLatitude, precision: 5) AS 'Lat',
      STRING(asnLongitude, precision: 5) As 'Lang'
SINCE 1 HOUR AGO
LIMIT MAX

References
- Learn more about latest.
- Learn more about map widget.
Number 7: If
What do you do when you need to perform a simple if-then-else control flow with your query to get a conditional output? NRQL provides you with an if() function, which comes in handy when combined with the SELECT clause.
Here's a simple example where we check the workload status and display the output as On or Off based on the statusValue property:
FROM WorkloadStatus
SELECT LATEST(IF(statusValue = 'OPERATIONAL', '🟢 On', '🔴 Off')) AS 'Workload Status'
SINCE 30 SECONDS AGO
.png)
Yes, you can totally use emojis in the labels 😄. NRQL supports most emojis 🤩.
References
- Read more about if().
Number 8: Aparse
aparse is a great function to extract specific values from a string. It allows you to parse strings that contain structured data and extract specific values from them. This can be especially useful when you need to analyze log data or other types of unstructured data.
aparse() takes two arguments:
- An attribute with a string value.
- A pattern of characters that includes anchor strings and characters to be extracted. For example, 'www.*.com' can be used to extract only the domain part from a URL.
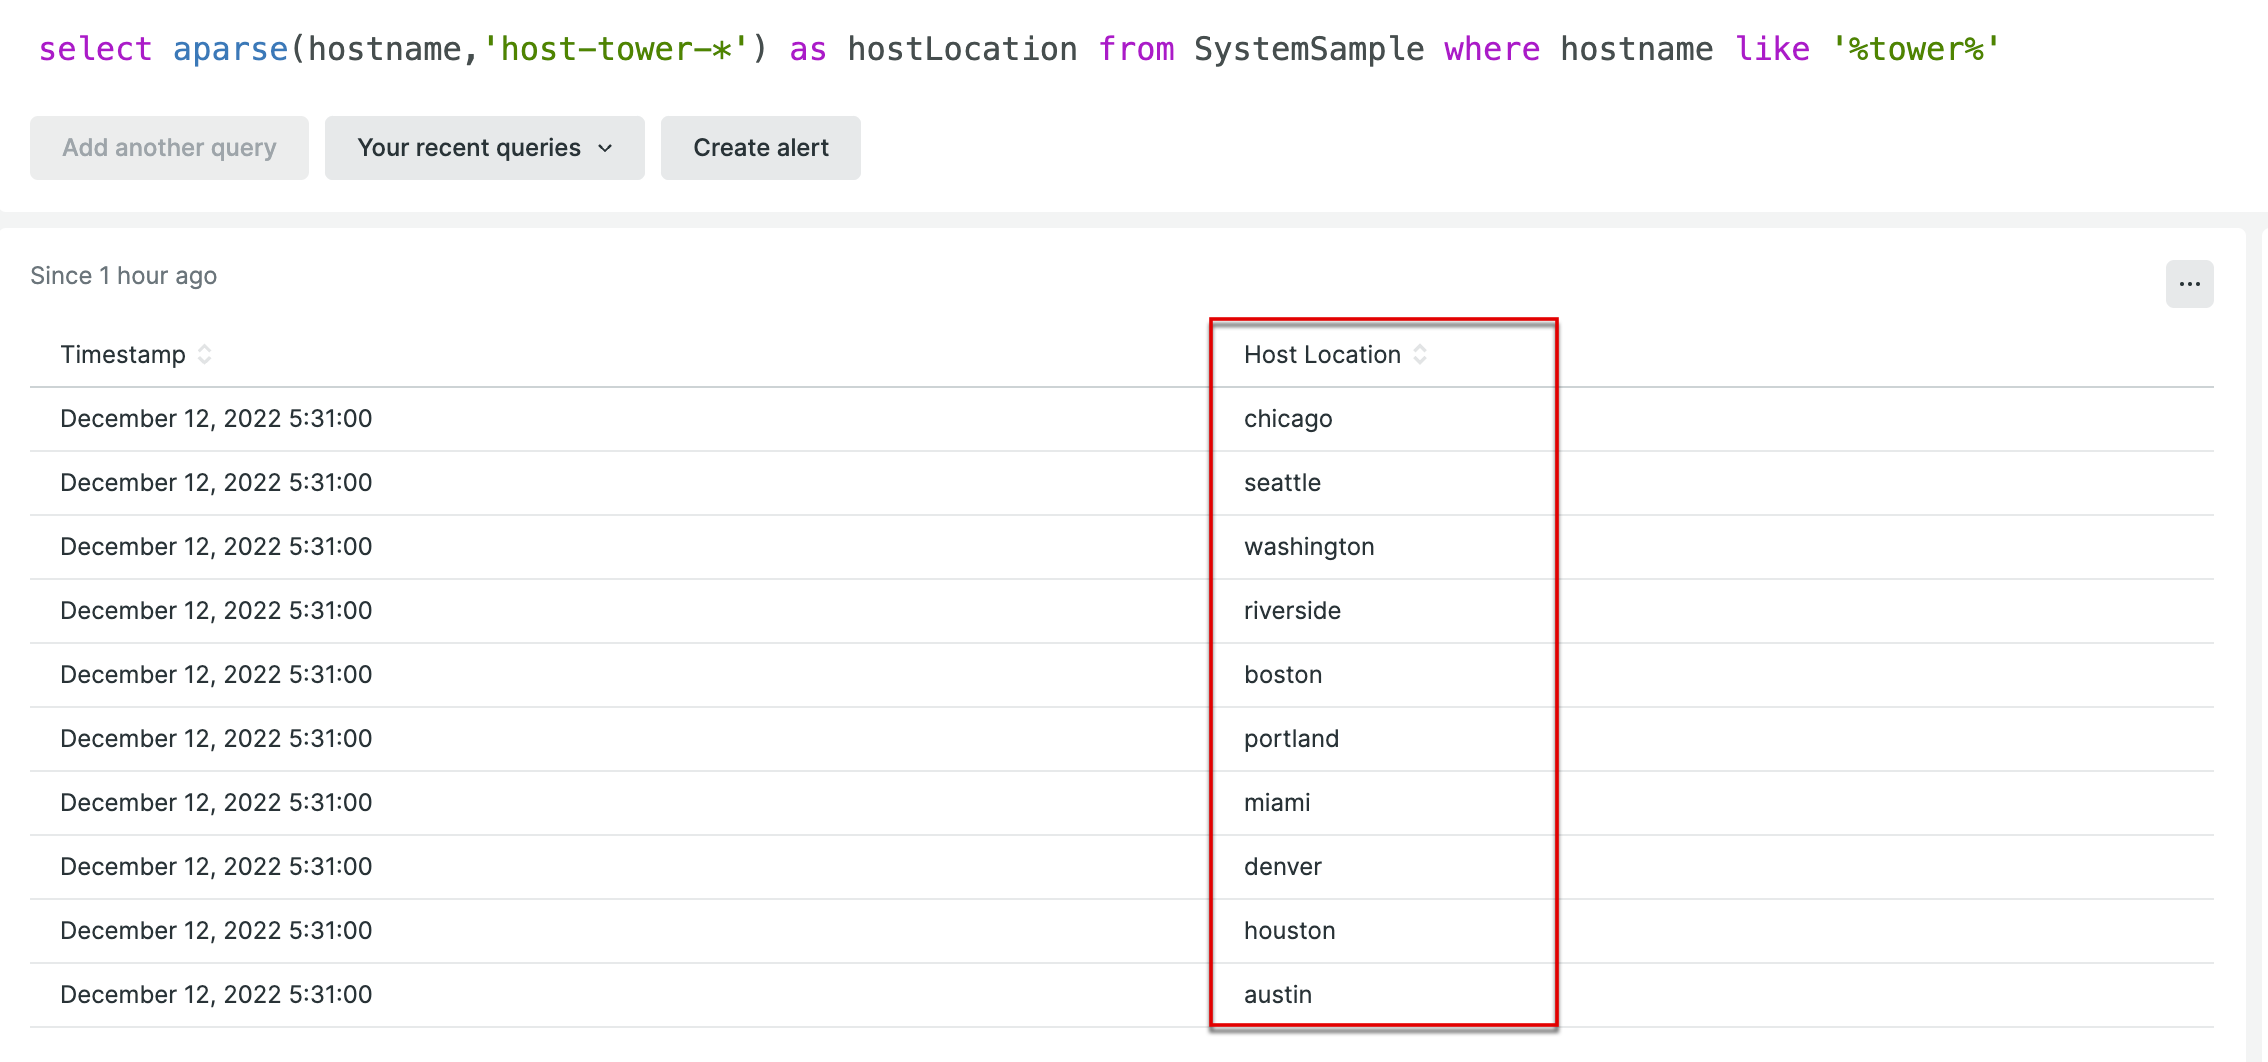
The following image is an example where the host location contains a pre-fixed value:

In the following sample, the query extracts only the desired part of the string from the result while retaining the location name after removing the prefix part based on the given anchor/regex pattern.
SELECT APARSE(hostname,'host-tower-*') AS hostLocation
FROM SystemSample
WHERE hostname LIKE '%tower%'

References
- Read more about aparse.
Number 9: Subqueries
NRQL also supports subqueries, which are queries within other queries. Subqueries are a powerful way to use multiple queries together in NRQL and generate results from multiple different datasets.
Here's a basic example where we filter and find all transactions for hosts that have log errors, without explicitly specifying any host names:
FROM Transaction
SELECT appId, appName, containerId, request.method
WHERE hostname = (
	FROM Log
	SELECT latest(host)
	WHERE level = 'ERROR'
)

Subquery with IN clause
Another good use case of a subquery is when you want to create a more dynamic query instead of writing multiple values for conditions. We can use the IN() clause with a subquery, which is useful when the filtering criteria might change or increase over time.
Here's a sample use case:
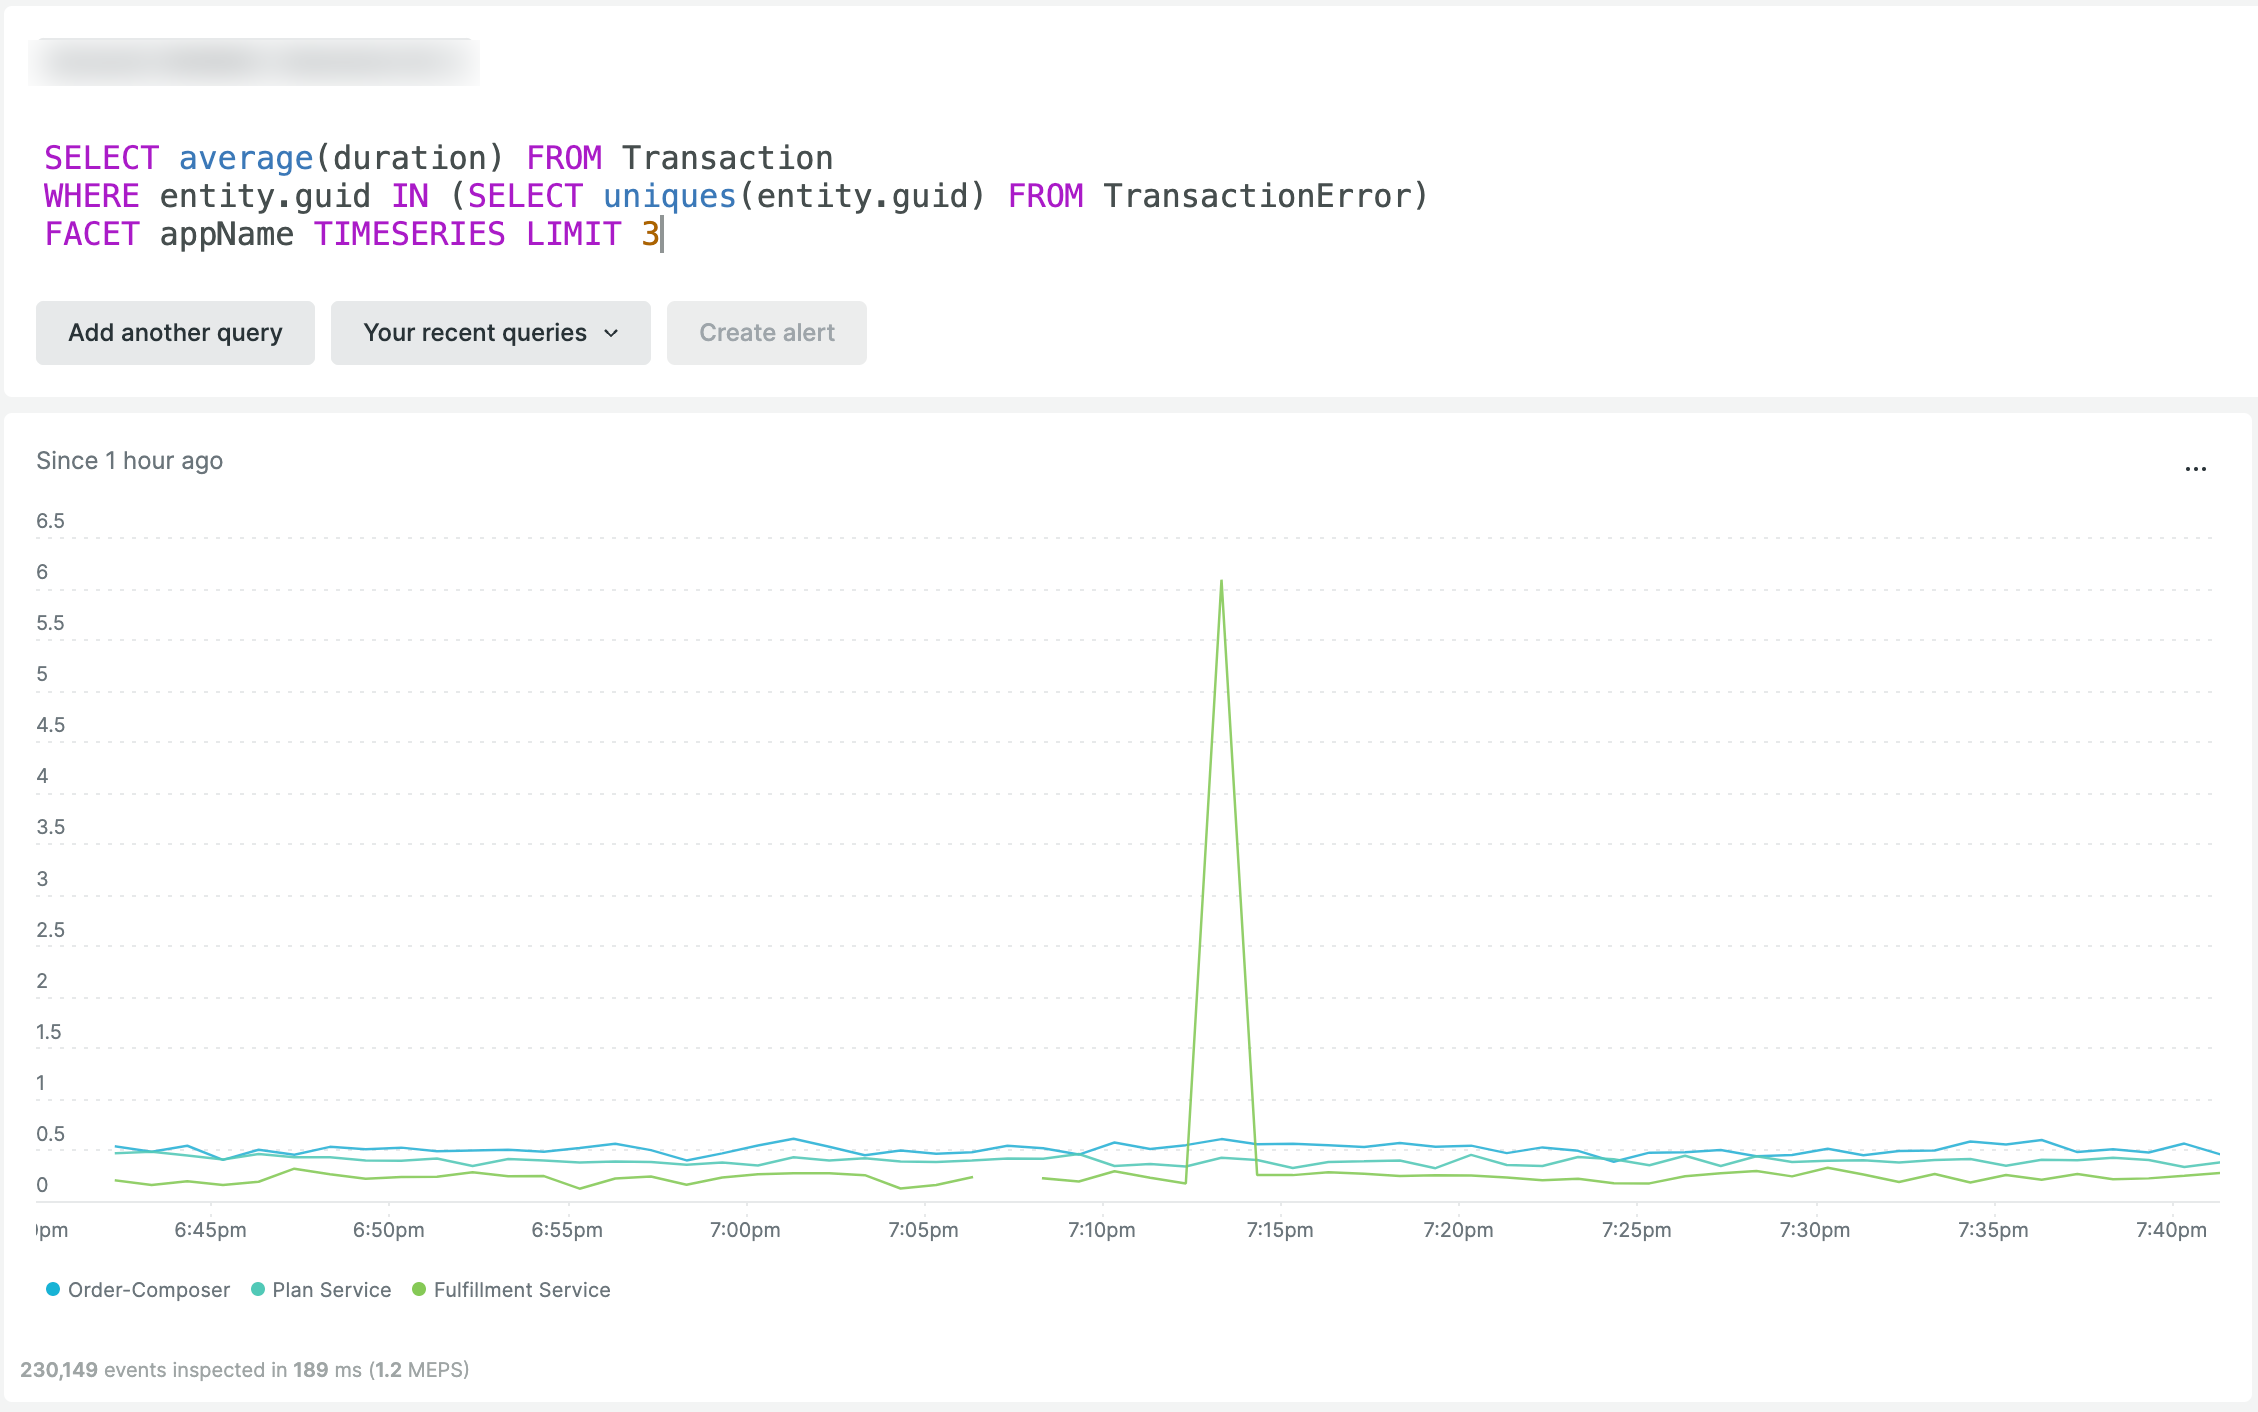
To find the average duration of all transactions for TransactionError across all the entities, we can use a sample query. This query searches for all entity.guids using a subquery and then applies the result to the WHERE clause for the aggregation of the average(duration).
SELECT AVERAGE(duration) FROM Transaction
WHERE entity.guid IN (SELECT UNIQUES(entity.guid) FROM TransactionError)
FACET appName TIMESERIES LIMIT 3

References
- Read more about subquery.
Number 10: Histograms and heatmaps
Histogram
Histograms allow users to quickly identify patterns, distributions, and trends in their data.
histogram() accepts three arguments:-
- Attribute name
- The maximum value of the sample range
- Total number of buckets (between 1 and 500) where range boundaries are inclusive
You can generate a histogram of response times from PageView, ranging up to 10 seconds over 20 buckets. The query basically produces an output of 20 different chunks of time (or buckets) on the X-axis for the total number of requests on the Y-axis for the attribute “duration�? from the PageView.
SELECT HISTOGRAM(duration, 10, 20) FROM PageView SINCE 1 week ago

Heatmaps
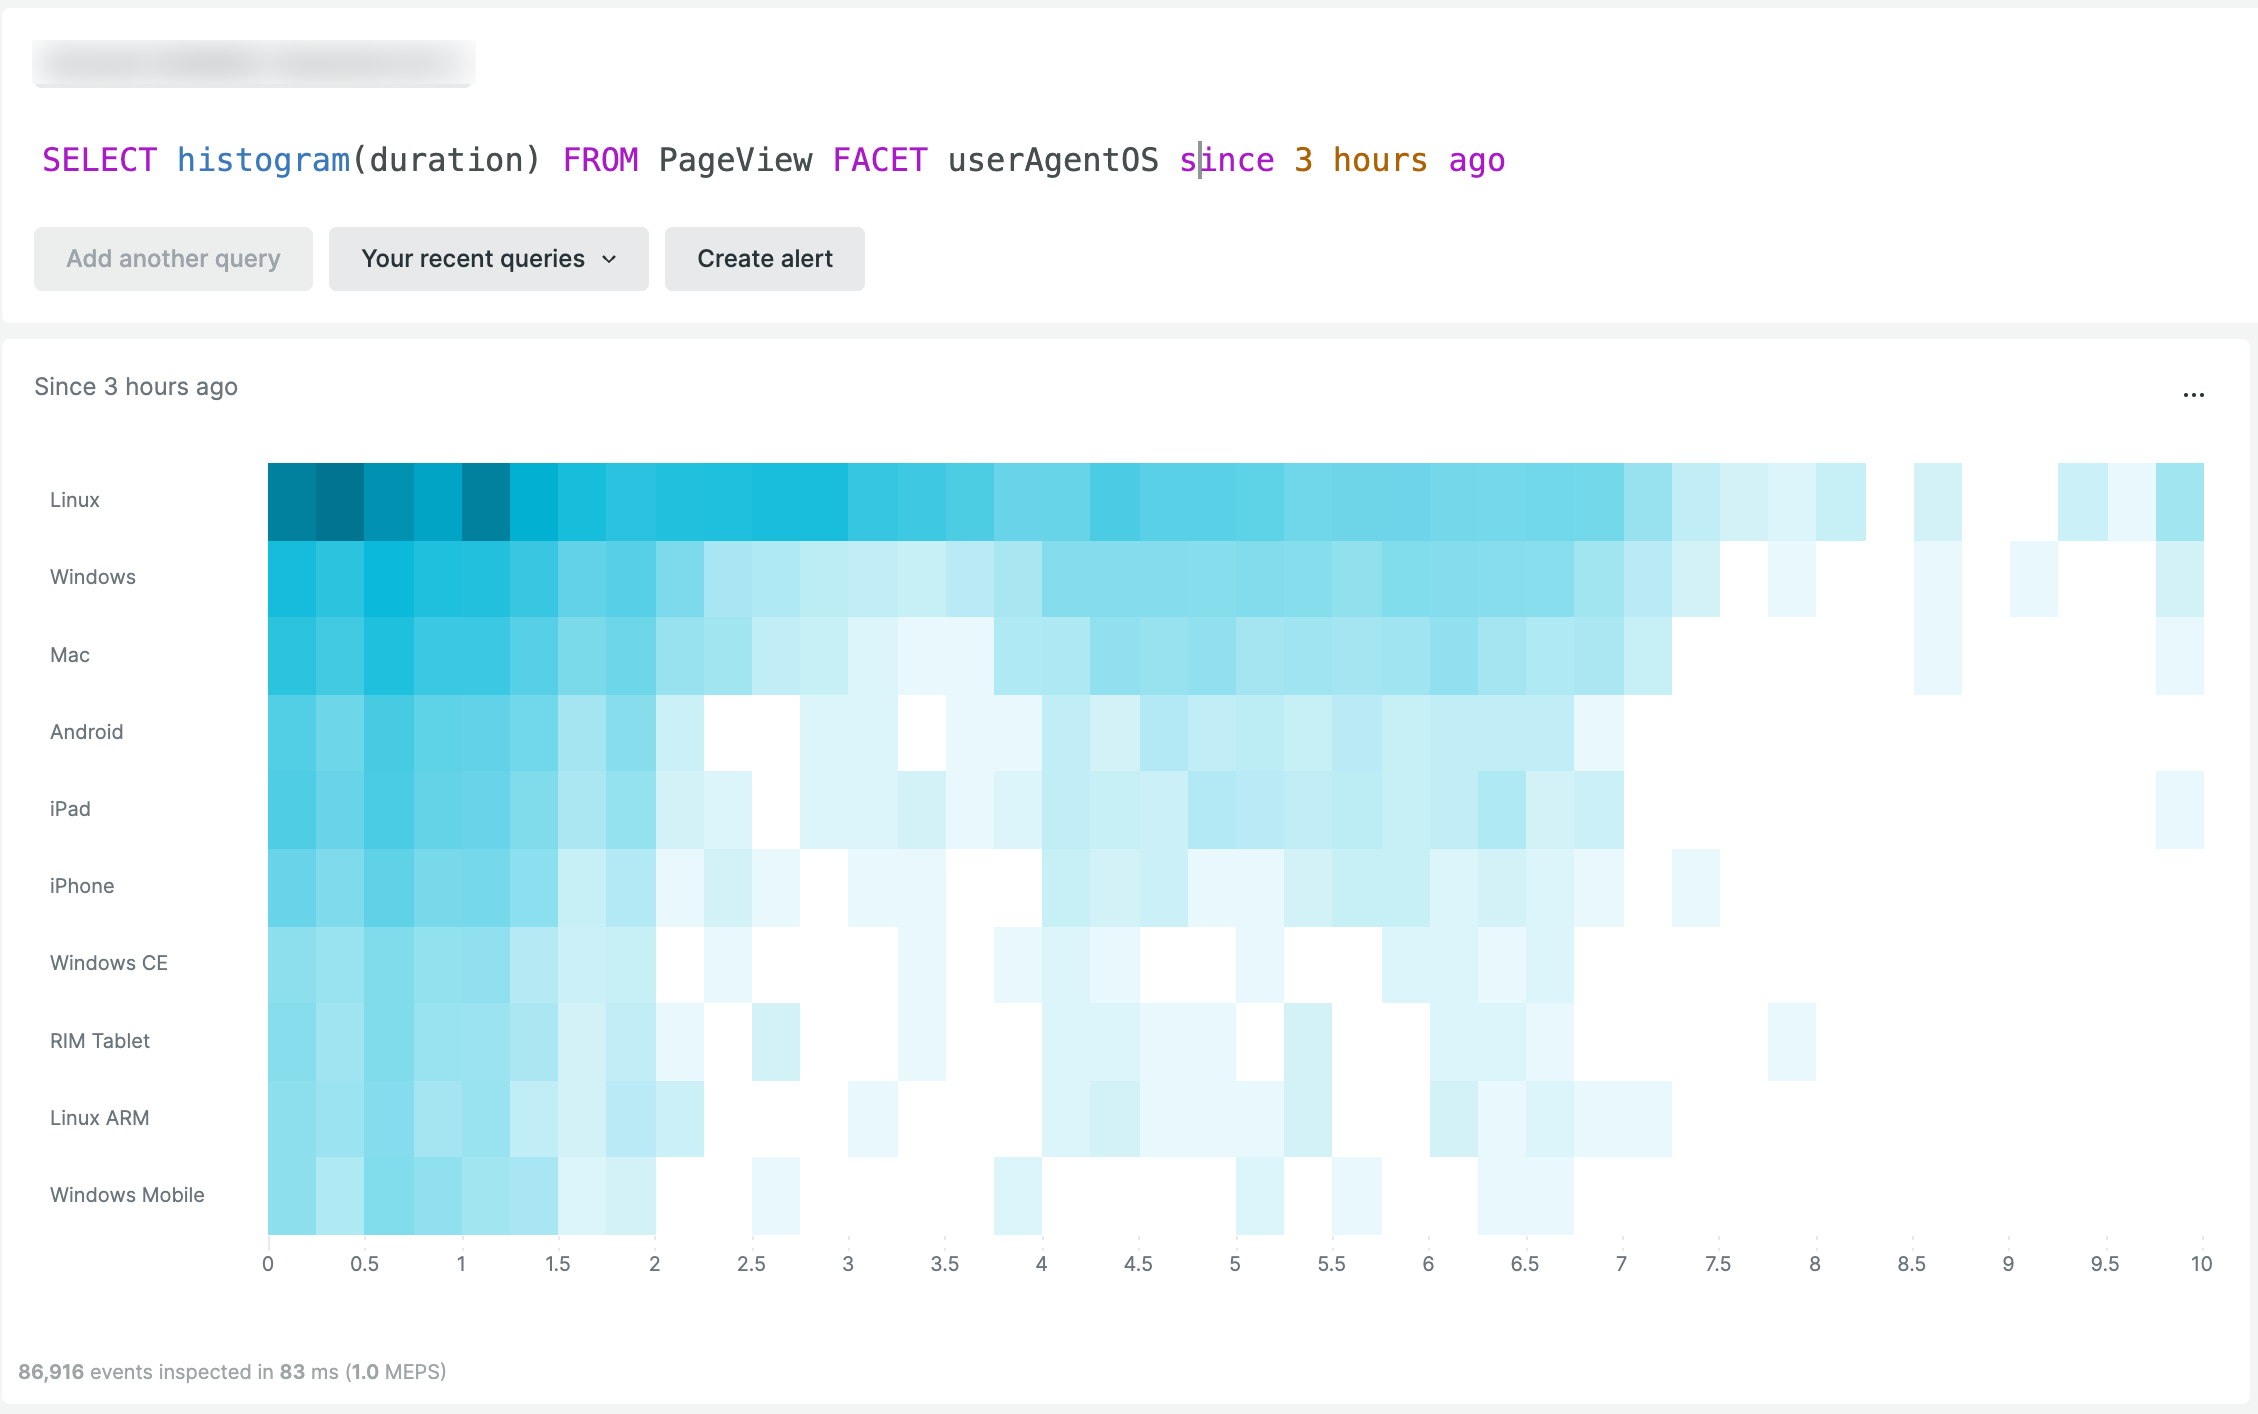
Heatmaps() are useful for visualizing patterns in a dataset. The color intensity in the heatmap changes from lighter to darker as the values increase or decrease.
To create a heatmap, use the Histogram() function with only a single attribute that is numeric and add a FACET clause. Here's an example of a heatmap showing the different operating systems from which our website has been accessed in the last three hours.
SELECT HISTOGRAM(duration) FROM PageView FACET userAgentOS SINCE 3 HOURS AGO

References
- Read more about histograms.
Top takeaways
Here's a list of all the functions and clauses covered in this series:
By mastering NRQL, you can capture and interpret your data, allowing you to break down the big picture into easily understandable pieces. This will help you identify problems as they occur and analyze your data in real time, gaining valuable insights. Whether you're looking to optimize performance, identify trends, or monitor key metrics to drive business decisions, NRQL is an indispensable tool that can help you understand your data comprehensively.
Next steps
If you're not already using New Relic, sign up for a free account to test out all of our features. Your free account includes 100 GB/month of free data ingest, one free full-access user, and unlimited free basic users.
- You can learn NRQL interactively by using our NRQL lesson app.
- Explore the New Relic query builder and build your custom charts and dashboards.
- Learn about our NRQL console and become an NRQL master.
- Coming from the Prometheus world? New Relic supports PromQL-style queries.
The views expressed on this blog are those of the author and do not necessarily reflect the views of New Relic. Any solutions offered by the author are environment-specific and not part of the commercial solutions or support offered by New Relic. Please join us exclusively at the Explorers Hub (discuss.newrelic.com) for questions and support related to this blog post. This blog may contain links to content on third-party sites. By providing such links, New Relic does not adopt, guarantee, approve or endorse the information, views or products available on such sites.


