
Labour Statistics: Technical Papers
The Labour Force Survey panel sample design and wage trends in Canada
Text begins
Average hourly wages from the Labour Force Survey (LFS) provide information on current wage dynamics and are among the most commonly used labour market indicators.Note Wages in the LFS are reported for employees working in all industries, excluding self-employment, before taxes and deductions and include tips and commissions.
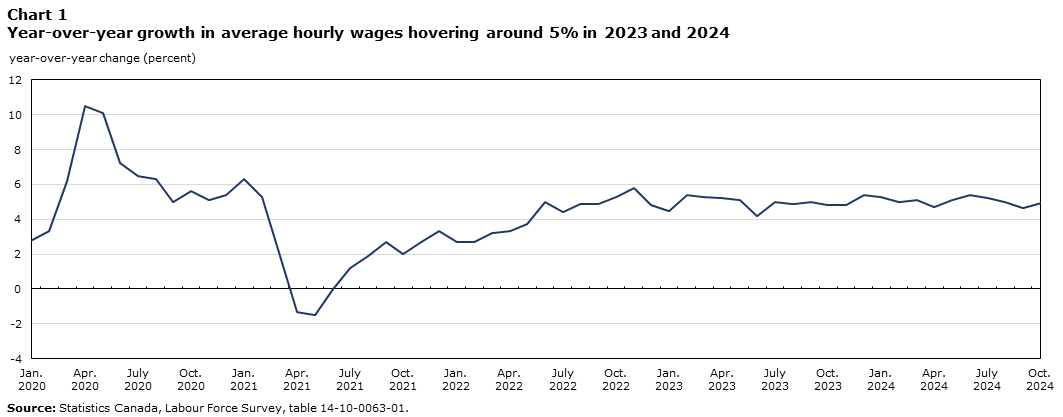
In October 2024, average hourly wages were up 4.9% on a year-over-year basis, following growth of 4.6% in the previous month. In 2023 and over the first ten months of 2024, year-over-year growth in average hourly wages hovered around 5%, following an acceleration in the second half of 2022, during which the growth rate peaked at 5.8% in November 2022 (Chart 1).
Data table for Chart 1
| Year-over-year change | |
|---|---|
| percent | |
| Source: Statistics Canada, Labour Force Survey, table 14-10-0063-01. | |
| 2020 | |
| January | 2.8 |
| February | 3.3 |
| March | 6.2 |
| April | 10.5 |
| May | 10.1 |
| June | 7.2 |
| July | 6.5 |
| August | 6.3 |
| September | 5.0 |
| October | 5.6 |
| November | 5.1 |
| December | 5.4 |
| 2021 | |
| January | 6.3 |
| February | 5.3 |
| March | 1.9 |
| April | -1.3 |
| May | -1.5 |
| June | 0.0 |
| July | 1.2 |
| August | 1.9 |
| September | 2.7 |
| October | 2.0 |
| November | 2.7 |
| December | 3.3 |
| 2022 | |
| January | 2.7 |
| February | 2.7 |
| March | 3.2 |
| April | 3.3 |
| May | 3.7 |
| June | 5.0 |
| July | 4.4 |
| August | 4.9 |
| September | 4.9 |
| October | 5.3 |
| November | 5.8 |
| December | 4.8 |
| 2023 | |
| January | 4.5 |
| February | 5.4 |
| March | 5.3 |
| April | 5.2 |
| May | 5.1 |
| June | 4.2 |
| July | 5.0 |
| August | 4.9 |
| September | 5.0 |
| October | 4.8 |
| November | 4.8 |
| December | 5.4 |
| 2024 | |
| January | 5.3 |
| February | 5.0 |
| March | 5.1 |
| April | 4.7 |
| May | 5.1 |
| June | 5.4 |
| July | 5.2 |
| August | 5.0 |
| September | 4.6 |
| October | 4.9 |
The LFS follows a rotating panel sample design, in which selected households answer questions about their labour force characteristics for six consecutive months. Information on employee wages is collected systematically for respondents in the first month of their participation in the survey. In subsequent interviews, respondents are given the opportunity to review information that was carried forward from the previous month. Any reported changes during this review, including a change in the name of the employer or type of work the employee is doing, triggers a new set of questions about wages. If a respondent remains in the same job from month to month and does not update employment information carried forward from the previous interview, the survey does not re-ask details about wages, thereby reducing respondent burden.
Because wage information is not systematically asked of each respondent during subsequent interviews, there is a possibility that average hourly wages, as reported in the LFS, could reflect changes in Canada’s wage dynamics with a lag. This report examines this question. It provides details on aspects of the LFS methodology which may impact the accuracy of the wage data, and provides information about situations in which respondents update their wage information over their six-month participation in the survey.
Overall, the report finds little evidence that the LFS collection methodology impacts the accuracy of wage data at the national level. Furthermore, the report shows that—for a variety of reasons—the majority of respondents update their wage information at least once throughout their six-month participation in the survey.
Wages in the LFS are collected based on a rotating panel design
Recently, the LFS sample has included over 65,000 households, resulting in labour data for well over 100,000 individuals. Household members aged 15 years and older are considered to be part of the survey target population, with some exclusions.Note Note In each dwelling, information about all eligible household members is obtained from one knowledgeable household member, a method known as proxy reporting, which accounts for approximately half of the information collected. This method is used to avoid the high cost and extended time requirements that would be involved in repeat visits or calls necessary to obtain information directly from each person.
The LFS has collected information on the usual wages or salary of employees at their main job since 1997. Respondents are asked to report their wage or salary before taxes and other deductions, excluding overtime and including tips and commissions. The respondent can choose to report their wages as hourly, weekly, bi-weekly, semi-monthly, monthly, or yearly. The LFS processing system then calculates weekly and hourly wages based on reported usual paid work hours per week. Average hourly wages, average weekly wages and wage distributions can then be cross-tabulated by other characteristics such as age, sex, education, occupation, union status, job permanency, and place of residence.
The LFS follows a rotating panel sample design, in which households remain in the sample for six consecutive months (herein referred to as month 1 to month 6).Note The total sample consists of six representative sub-samples or panels, and each month the panel that has completed its six-month participation in the survey is replaced. Outgoing households are replaced by households in the same or a similar area.
The “entering rotation” refers to those respondents who are completing their first of six months in the LFS. Respondents in this rotation group receive the most comprehensive set of survey questions. It is during the first month that wages are reported by the reference person for the household members.
To reduce respondent burden, the “other rotation groups”—those in month 2 to month 6 of their LFS participation—are not explicitly re-asked every survey question each month. However, they are given the opportunity to review information that was carried forward from their previous interview and can update information about their current job or report a change. Respondents with a job or business are prompted with pre-filled information from the previous month and asked to confirm the name of their employer, the type of business, the type of work they do, as well as the start date of their current job (see Appendix 1 for list of questions that respondents are asked to review each month).
While wage is not one of the details presented for review each month, respondents are re-asked the wage question if they report a change to other aspects of their current job or business. In this way, many respondents can update previously recorded information and provide new wage information. Other changes to wage information during a respondent’s six-month participation in the survey may occur due to a combination of other collection and processing factors: imputation for missing records, and other processing calculations related to changes in other variables (such as reported usual hours).
Flows within a six-month panel group are dynamic; the majority of respondents update their wage information
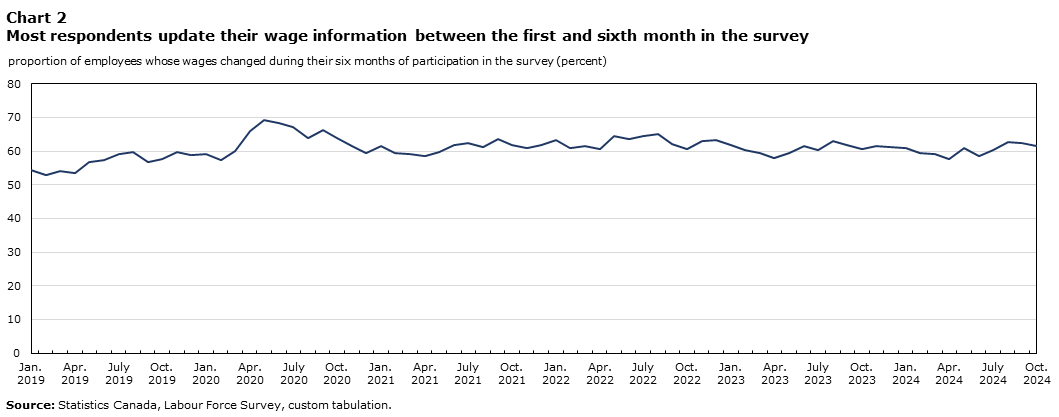
On average between January 2019 and October 2024, 60.9% of respondents who were employees with wages updated their wage information during their six-month participation in the survey.Note In other words, for the majority of employees, the wage information was changed at some point during month 2 to 6, compared with the information initially provided in the first month.
On the other hand, among respondents who were employees, 39.1% retained the same wage information between their first and sixth month of participation in the survey. These employees were more likely to be in permanent jobs compared with those who reported wages changes between their first and sixth month participating in the survey.Note
Data table for Chart 2
| Proportion of employees whose wages changed during their six months of participation in the survey | |
|---|---|
| percent | |
| Source: Statistics Canada, Labour Force Survey, custom tabulation. | |
| 2019 | |
| January | 54.4 |
| February | 52.8 |
| March | 54.0 |
| April | 53.5 |
| May | 56.9 |
| June | 57.4 |
| July | 59.1 |
| August | 59.8 |
| September | 56.8 |
| October | 57.8 |
| November | 59.7 |
| December | 58.8 |
| 2020 | |
| January | 59.2 |
| February | 57.3 |
| March | 60.0 |
| April | 66.1 |
| May | 69.3 |
| June | 68.4 |
| July | 67.1 |
| August | 64.0 |
| September | 66.4 |
| October | 63.8 |
| November | 61.4 |
| December | 59.6 |
| 2021 | |
| January | 61.5 |
| February | 59.4 |
| March | 59.2 |
| April | 58.5 |
| May | 59.8 |
| June | 61.8 |
| July | 62.5 |
| August | 61.1 |
| September | 63.7 |
| October | 61.8 |
| November | 61.0 |
| December | 61.7 |
| 2022 | |
| January | 63.2 |
| February | 60.9 |
| March | 61.6 |
| April | 60.5 |
| May | 64.4 |
| June | 63.5 |
| July | 64.5 |
| August | 65.2 |
| September | 62.0 |
| October | 60.5 |
| November | 63.0 |
| December | 63.4 |
| 2023 | |
| January | 62.0 |
| February | 60.4 |
| March | 59.6 |
| April | 57.9 |
| May | 59.4 |
| June | 61.4 |
| July | 60.5 |
| August | 63.0 |
| September | 61.8 |
| October | 60.5 |
| November | 61.6 |
| December | 61.1 |
| 2024 | |
| January | 61.0 |
| February | 59.4 |
| March | 59.2 |
| April | 57.6 |
| May | 60.8 |
| June | 58.5 |
| July | 60.4 |
| August | 62.6 |
| September | 62.5 |
| October | 61.7 |

Data table for Chart 3
| Wage data collection | Proportion of respondents with wage data collected in first or subsequent interview | Proportion of respondents with wage data that changed or remained the same between the first and sixth interview |
|---|---|---|
| percent | ||
Source: Statistics Canada, Labour Force Survey, custom tabulation. |
||
| Wage data collected in first interview | 90.9 | ... not applicable |
| Wage data collected in subsequent interview | 9.1 | ... not applicable |
| Total | 100.0 | ... not applicable |
| Outcome from total | ||
| Wage remained the same | ... not applicable | 39.1 |
| Wage increased | ... not applicable | 24.6 |
| Wage declined | ... not applicable | 18.8 |
| Lost wage due to job loss (or becoming self-employed) | ... not applicable | 8.4 |
| Obtained wage in subsequent interview | ... not applicable | 9.1 |
| Total | ... not applicable | 100.0 |
One-quarter of respondents reported a wage increase between their first and sixth month in the survey
From January 2019 to October 2024, about one-quarter (24.6%) of employees in the LFS reported a wage increase between the first and the sixth month in the survey, either due to switching jobs or due to updating information about a current job (Chart 3). About half (46.4%) of those with wage increases worked for the same employer in the first and sixth month, while the remainder reported a different employer name. This indicates that many respondents staying with the same employer and getting adjustments to their wages are reporting them in subsequent interviews.
Just under one-fifth (18.8%) reported a wage decrease between their first and sixth month, with about half reporting a different employer name (46.9%).
In addition to those who update information about their current wage in subsequent months, there are people who had obtained paid employment and reported a wage (9.1%) for the first time after the first interview. There were also people who had lost their job (or had become self-employed) and no longer reported wages (8.4%) between the first and sixth month.
These dynamic flows contribute new and up-to-date wage information to the monthly cross-sectional average hourly wage as reported each month. These results indicate that wage information for LFS respondents is dynamic, despite the survey not systematically repeating the wage question each month.
Trends in wage changes among entering rotation are similar to those of the other rotation groups
Carrying forward a respondent’s information from the previous month and not systematically re-asking all survey questions—including questions about wages—helps to reduce response burden. It also reduces the risk of introducing month-to-month volatility in the wage data that may arise from reporting errors. The methodology can introduce a risk of reducing the accuracy of the wage data; however, this risk is mitigated by new rotating panels entering each month, who are systematically asked about their wages.
In addition to workers seeing their wage increase or decrease from month to month, wage changes at the aggregate level can be driven by broad compositional changes in the labour market. For example, when people enter or leave employment, the composition of employment by industry is changed. These employment dynamics can result in aggregate wage changes. The LFS is designed to rapidly capture compositional changes in the labour market by confirming the labour force status of each respondent every month.Note In this way, wage data from both the entering rotation and the other rotation groups would reflect the shifting employment composition and its impact on average wages.
To examine the extent to which the rotating panel design of the LFS introduces a lag in wage dynamics, one can isolate the data from the entering rotation and compare them with those of the other rotation groups. In other words, wages of those in the entering rotation who completed the questionnaire for the first time can be compared with the other rotation groups whose data were either carried forward unchanged, or updated if they reported a change. If the accuracy of the wages series is significantly impacted by the LFS collection methodology, one would expect trends in the entering rotation group’s wages to lead those of the other rotation groups.
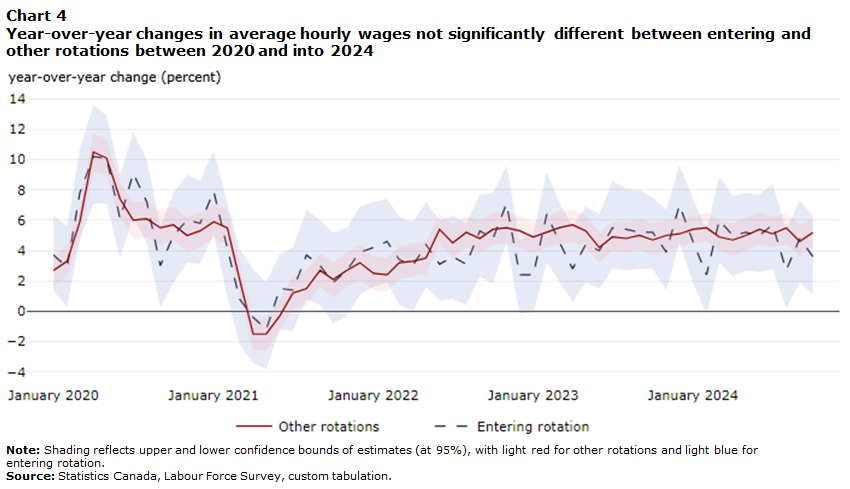
The year-over-year wage growth rates for the entering rotation and the other rotation groups from January 2020 to October 2024 are presented in Chart 4. The isolated series using only the entering rotation shows more variability, as it is based on a much smaller sample size (one-sixth of the total sample). However, trends are virtually identical over several distinct periods during the COVID-19 pandemic, and in the following recovery years, with little evidence of a leading or lagging effect. Over the period considered, the difference in growth rates between the two series is never statistically significant.
Data table for Chart 4
| Year-over-year change in average hourly wages | ||
|---|---|---|
| Entering rotation | Other rotations | |
| percent | ||
| Note: Shading reflects upper and lower confidence bounds of estimates (at 95%), with light red for other rotations and light blue for entering rotation.
Source: Statistics Canada, Labour Force Survey, custom tabulation. |
||
| 2020 | ||
| January | 3.7 | 2.7 |
| February | 2.9 | 3.3 |
| March | 7.8 | 5.9 |
| April | 10.2 | 10.5 |
| May | 10.1 | 10.1 |
| June | 6.1 | 7.4 |
| July | 9.1 | 6.0 |
| August | 7.2 | 6.1 |
| September | 3.0 | 5.5 |
| October | 5.0 | 5.7 |
| November | 6.0 | 5.0 |
| December | 5.8 | 5.3 |
| 2021 | ||
| January | 7.9 | 5.9 |
| February | 4.1 | 5.5 |
| March | 0.8 | 2.1 |
| April | -0.4 | -1.5 |
| May | -1.2 | -1.5 |
| June | 1.5 | -0.3 |
| July | 1.4 | 1.2 |
| August | 3.7 | 1.5 |
| September | 3.0 | 2.7 |
| October | 1.9 | 2.1 |
| November | 2.7 | 2.7 |
| December | 3.9 | 3.2 |
| 2022 | ||
| January | 4.2 | 2.5 |
| February | 4.6 | 2.4 |
| March | 3.4 | 3.2 |
| April | 3.0 | 3.3 |
| May | 4.4 | 3.5 |
| June | 3.1 | 5.4 |
| July | 3.6 | 4.5 |
| August | 3.1 | 5.2 |
| September | 5.3 | 4.8 |
| October | 4.8 | 5.4 |
| November | 7.1 | 5.5 |
| December | 2.4 | 5.3 |
| 2023 | ||
| January | 2.4 | 4.9 |
| February | 6.4 | 5.2 |
| March | 4.6 | 5.5 |
| April | 2.8 | 5.7 |
| May | 4.4 | 5.3 |
| June | 4.0 | 4.2 |
| July | 5.5 | 4.9 |
| August | 5.4 | 4.8 |
| September | 5.2 | 5.0 |
| October | 5.2 | 4.7 |
| November | 3.9 | 5.0 |
| December | 7.0 | 5.1 |
| 2024 | ||
| January | 4.6 | 5.4 |
| February | 2.4 | 5.5 |
| March | 6.0 | 4.9 |
| April | 5.0 | 4.7 |
| May | 5.2 | 5.0 |
| June | 5.0 | 5.4 |
| July | 5.7 | 5.1 |
| August | 2.7 | 5.5 |
| September | 4.8 | 4.6 |
| October | 3.6 | 5.2 |
Conclusion
The analysis presented in this report finds little evidence that the accuracy of wage trends in the LFS is significantly impacted by its rotating panel and questionnaire design. Specifically, variations in the wages of entering rotation groups were similar to those for respondents already in the sample. The analysis also highlighted that the majority of employees update their wage information throughout their six-month participation in the survey, providing timely wage information each month.
In addition to wage data from the LFS, users are encouraged to monitor trends in average weekly earnings from the Survey of Employment, Payroll and Hours (SEPH). Average weekly earnings from SEPH are derived by combining each month the most recent available information from payroll deduction remittance (PD7) forms received from the Canada Revenue Agency (CRA) and information from respondents to the Business Payroll Survey (BPS). The report "Earnings and Wages – A guide to using indicators from the Survey of Employment, Payrolls and Hours and the Labour Force Survey" provides information on definitions for wage and earnings indicators from the LFS and SEPH, highlights key conceptual and measurement differences between the two surveys, and provides guidance to data users on when to use each indicator.
Appendix 1
Questions with information carried-forward from the previous month that respondents are asked to review while completing the questionnaire each month:
- For whom did you work? (name of company, business, etc.)
- What kind of business, industry or service was this? (i.e.: new home construction, primary school, municipal police, etc.)
- What kind of work were you doing? (i.e.: legal secretary, plumber, fishing guide, etc.)
- What were your most important activities or duties? (i.e.: prepared legal documents, installed residential plumbing, guided fishing parties, etc.)
- When did you start working at your current job (month and year)?
- Date modified: