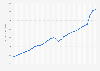
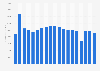
The Mexican retail group Sanborns generated a sales revenue of approximately 40 billion Mexican pesos in 2020 —around two billion U.S. dollars based on the exchange rates of December 31st of that year. In comparison the previous year's results, this figure represents a drop of 26 percent. Grupo Sanborns operates stores in different formats in Mexico, El Salvador, and Panama.
Sales revenue of Grupo Sanborns S.A.B. de C.V. from 2014 to 2021
(in billion Mexican pesos)
Profit from the additional features of your individual account
Currently, you are using a shared account. To use individual functions (e.g., mark statistics as favourites, set
statistic alerts) please log in with your personal account.
If you are an admin, please authenticate by logging in again.
Learn more about how Statista can support your business.
Grupo Sanborns. (March 31, 2022). Sales revenue of Grupo Sanborns S.A.B. de C.V. from 2014 to 2021 (in billion Mexican pesos) [Graph]. In Statista. Retrieved March 24, 2025, from https://www.statista.com/statistics/1021000/sanborns-sales-revenue/?__sso_cookie_checker=failed
Grupo Sanborns. "Sales revenue of Grupo Sanborns S.A.B. de C.V. from 2014 to 2021 (in billion Mexican pesos)." Chart. March 31, 2022. Statista. Accessed March 24, 2025. https://www.statista.com/statistics/1021000/sanborns-sales-revenue/?__sso_cookie_checker=failed
Grupo Sanborns. (2022). Sales revenue of Grupo Sanborns S.A.B. de C.V. from 2014 to 2021 (in billion Mexican pesos). Statista. Statista Inc.. Accessed: March 24, 2025. https://www.statista.com/statistics/1021000/sanborns-sales-revenue/?__sso_cookie_checker=failed
Grupo Sanborns. "Sales Revenue of Grupo Sanborns S.A.B. De C.V. from 2014 to 2021 (in Billion Mexican Pesos)." Statista, Statista Inc., 31 Mar 2022, https://www.statista.com/statistics/1021000/sanborns-sales-revenue/?__sso_cookie_checker=failed
Grupo Sanborns, Sales revenue of Grupo Sanborns S.A.B. de C.V. from 2014 to 2021 (in billion Mexican pesos) Statista, https://www.statista.com/statistics/1021000/sanborns-sales-revenue/?__sso_cookie_checker=failed (last visited March 24, 2025)
Sales revenue of Grupo Sanborns S.A.B. de C.V. from 2014 to 2021 (in billion Mexican pesos) [Graph], Grupo Sanborns, March 31, 2022. [Online]. Available: https://www.statista.com/statistics/1021000/sanborns-sales-revenue/?__sso_cookie_checker=failed