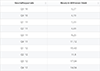
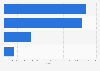
One third of all wearable transactions in Europe in 2019 came from the Netherlands, followed by the United Kingdom, Switzerland and Russia. This according to data from MasterCard, which processed the payment transactions. The source mentions six other countries where wearables (which includes smartwatches, rings or jewellery) were used to pay for purchases in a store, but did not provide specific numbers. These six countries were, in descending order: Poland, Sweden, Czechia, Finland, Germany and Ukraine. The source, however, does not mention how many times consumers used wearables or how much money they paid per transaction. Finally, the source also does not mention whether the six countries mentioned earlier make up the remaining 34 percent of the European transactions.
Distribution of payment transactions via wearables across selected countries in Europe in 2019
Characteristic
Share of total wearable payment transactions in Europe
Numbers concern payments processed by MasterCard; Includes both active wearables (which includes a battery), as well as passive wearables (without a battery, like armbands, rings and traditional watches).
Supplementary notes
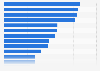
The source only provided numbers for the four mentioned countries. It adds that the "top ten European countries in wearable transactions" were:
Netherlands
United Kingdom
Switzerland
Russia
Poland
Sweden
Czechia
Finland
Germany
Ukraine
Also, the source mentions that "all countries in global top ten are European", bar Australia (in first place) and the United States (in eighth).
Profit from the additional features of your individual account
Currently, you are using a shared account. To use individual functions (e.g., mark statistics as favourites, set
statistic alerts) please log in with your personal account.
If you are an admin, please authenticate by logging in again.
Learn more about how Statista can support your business.
MasterCard. (November 28, 2019). Distribution of payment transactions via wearables across selected countries in Europe in 2019 [Graph]. In Statista. Retrieved March 07, 2025, from https://www.statista.com/statistics/1080078/use-of-wearable-technology-for-pos-payments-in-europe-by-country/?__sso_cookie_checker=failed
MasterCard. "Distribution of payment transactions via wearables across selected countries in Europe in 2019." Chart. November 28, 2019. Statista. Accessed March 07, 2025. https://www.statista.com/statistics/1080078/use-of-wearable-technology-for-pos-payments-in-europe-by-country/?__sso_cookie_checker=failed
MasterCard. (2019). Distribution of payment transactions via wearables across selected countries in Europe in 2019. Statista. Statista Inc.. Accessed: March 07, 2025. https://www.statista.com/statistics/1080078/use-of-wearable-technology-for-pos-payments-in-europe-by-country/?__sso_cookie_checker=failed
MasterCard. "Distribution of Payment Transactions via Wearables across Selected Countries in Europe in 2019." Statista, Statista Inc., 28 Nov 2019, https://www.statista.com/statistics/1080078/use-of-wearable-technology-for-pos-payments-in-europe-by-country/?__sso_cookie_checker=failed
MasterCard, Distribution of payment transactions via wearables across selected countries in Europe in 2019 Statista, https://www.statista.com/statistics/1080078/use-of-wearable-technology-for-pos-payments-in-europe-by-country/?__sso_cookie_checker=failed (last visited March 07, 2025)
Distribution of payment transactions via wearables across selected countries in Europe in 2019 [Graph], MasterCard, November 28, 2019. [Online]. Available: https://www.statista.com/statistics/1080078/use-of-wearable-technology-for-pos-payments-in-europe-by-country/?__sso_cookie_checker=failed