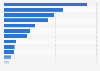
A.P. Møller - Maersk A/S transported over 11.9 million FFE of cargo in its 2022 fiscal year. This represents a decrease in the loaded volume of some nine percent compared with 2021. The most freight was transported between the East and the West, amounting to nearly 5.5 million FFE in 2022.
Volume of freight transported by A.P. Møller - Maersk A/S globally from FY 2020 to FY 2022, by direction
(in 1,000 FFE)
Profit from the additional features of your individual account
Currently, you are using a shared account. To use individual functions (e.g., mark statistics as favourites, set
statistic alerts) please log in with your personal account.
If you are an admin, please authenticate by logging in again.
Learn more about how Statista can support your business.
Statista. (February 8, 2023). Volume of freight transported by A.P. Møller - Maersk A/S globally from FY 2020 to FY 2022, by direction (in 1,000 FFE) [Graph]. In Statista. Retrieved April 02, 2025, from https://www.statista.com/statistics/1296652/ap-moeller-maersk-cargo-loaded-volumes-direction/?__sso_cookie_checker=failed
Statista. "Volume of freight transported by A.P. Møller - Maersk A/S globally from FY 2020 to FY 2022, by direction (in 1,000 FFE)." Chart. February 8, 2023. Statista. Accessed April 02, 2025. https://www.statista.com/statistics/1296652/ap-moeller-maersk-cargo-loaded-volumes-direction/?__sso_cookie_checker=failed
Statista. (2023). Volume of freight transported by A.P. Møller - Maersk A/S globally from FY 2020 to FY 2022, by direction (in 1,000 FFE). Statista. Statista Inc.. Accessed: April 02, 2025. https://www.statista.com/statistics/1296652/ap-moeller-maersk-cargo-loaded-volumes-direction/?__sso_cookie_checker=failed
Statista. "Volume of Freight Transported by A.P. Møller - Maersk A/S Globally from Fy 2020 to Fy 2022, by Direction (in 1,000 Ffe)." Statista, Statista Inc., 8 Feb 2023, https://www.statista.com/statistics/1296652/ap-moeller-maersk-cargo-loaded-volumes-direction/?__sso_cookie_checker=failed
Statista, Volume of freight transported by A.P. Møller - Maersk A/S globally from FY 2020 to FY 2022, by direction (in 1,000 FFE) Statista, https://www.statista.com/statistics/1296652/ap-moeller-maersk-cargo-loaded-volumes-direction/?__sso_cookie_checker=failed (last visited April 02, 2025)
Volume of freight transported by A.P. Møller - Maersk A/S globally from FY 2020 to FY 2022, by direction (in 1,000 FFE) [Graph], Statista, February 8, 2023. [Online]. Available: https://www.statista.com/statistics/1296652/ap-moeller-maersk-cargo-loaded-volumes-direction/?__sso_cookie_checker=failed