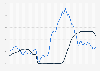
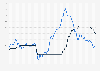
The value of M2 money supply in the U.S. amounted to 20.86 trillion U.S. dollars in 2023, which was a slight decrease compared to the previous year. While between 2000 and 2019, the M2 money supply increased at a relatively slow pace, there was an exceptionally sharp increase in 2020, which was the result of the Federal Reserve's quantitative easing in response to the COVID-19 pandemic.
Value of M2 money stock in the United States from 2000 to 2023
(in billion U.S. dollars)
The source adds the following information: M2 includes a broader set of financial assets held principally by households. M2 consists of M1 plus: savings deposits; small-denomination time deposits (time deposits in amounts of less than 100,000 U.S. dollars); and balances in retail money market mutual funds (MMMFs).
Seasonally adjusted M2 is computed by summing savings deposits, small-denomination time deposits, and retail MMMFs, each seasonally adjusted separately, and adding this result to seasonally adjusted M1.
Profit from the additional features of your individual account
Currently, you are using a shared account. To use individual functions (e.g., mark statistics as favourites, set
statistic alerts) please log in with your personal account.
If you are an admin, please authenticate by logging in again.
Learn more about how Statista can support your business.
Federal Reserve. (July 23, 2024). Value of M2 money stock in the United States from 2000 to 2023 (in billion U.S. dollars) [Graph]. In Statista. Retrieved February 02, 2025, from https://www.statista.com/statistics/187729/total-us-money-stock-for-m2-since-1990/?__sso_cookie_checker=failed
Federal Reserve. "Value of M2 money stock in the United States from 2000 to 2023 (in billion U.S. dollars)." Chart. July 23, 2024. Statista. Accessed February 02, 2025. https://www.statista.com/statistics/187729/total-us-money-stock-for-m2-since-1990/?__sso_cookie_checker=failed
Federal Reserve. (2024). Value of M2 money stock in the United States from 2000 to 2023 (in billion U.S. dollars). Statista. Statista Inc.. Accessed: February 02, 2025. https://www.statista.com/statistics/187729/total-us-money-stock-for-m2-since-1990/?__sso_cookie_checker=failed
Federal Reserve. "Value of M2 Money Stock in The United States from 2000 to 2023 (in Billion U.S. Dollars)." Statista, Statista Inc., 23 Jul 2024, https://www.statista.com/statistics/187729/total-us-money-stock-for-m2-since-1990/?__sso_cookie_checker=failed
Federal Reserve, Value of M2 money stock in the United States from 2000 to 2023 (in billion U.S. dollars) Statista, https://www.statista.com/statistics/187729/total-us-money-stock-for-m2-since-1990/?__sso_cookie_checker=failed (last visited February 02, 2025)
Value of M2 money stock in the United States from 2000 to 2023 (in billion U.S. dollars) [Graph], Federal Reserve, July 23, 2024. [Online]. Available: https://www.statista.com/statistics/187729/total-us-money-stock-for-m2-since-1990/?__sso_cookie_checker=failed