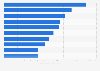
The majority of 18 to 44-year-old U.S. consumers preferred to binge-watch a whole series, according to 40 percent of respondents to a 2023 survey. In comparison, the share of viewers aged 45 years and older stating to do so was 29 percent, while most of the people interviewed in this age group said that this depends on the TV show.
Preference on number of TV show episodes watched per sitting in the United States as of February 2023
Profit from the additional features of your individual account
Currently, you are using a shared account. To use individual functions (e.g., mark statistics as favourites, set
statistic alerts) please log in with your personal account.
If you are an admin, please authenticate by logging in again.
Learn more about how Statista can support your business.
MediaPost (@MediaPost). (February 12, 2023). Preference on number of TV show episodes watched per sitting in the United States as of February 2023 [Graph]. In Statista. Retrieved March 26, 2025, from https://www.statista.com/statistics/289653/tv-shows-release-preference-us/?__sso_cookie_checker=failed
MediaPost (@MediaPost). "Preference on number of TV show episodes watched per sitting in the United States as of February 2023." Chart. February 12, 2023. Statista. Accessed March 26, 2025. https://www.statista.com/statistics/289653/tv-shows-release-preference-us/?__sso_cookie_checker=failed
MediaPost (@MediaPost). (2023). Preference on number of TV show episodes watched per sitting in the United States as of February 2023. Statista. Statista Inc.. Accessed: March 26, 2025. https://www.statista.com/statistics/289653/tv-shows-release-preference-us/?__sso_cookie_checker=failed
MediaPost (@MediaPost). "Preference on Number of Tv Show Episodes Watched per Sitting in The United States as of February 2023." Statista, Statista Inc., 12 Feb 2023, https://www.statista.com/statistics/289653/tv-shows-release-preference-us/?__sso_cookie_checker=failed
MediaPost (@MediaPost), Preference on number of TV show episodes watched per sitting in the United States as of February 2023 Statista, https://www.statista.com/statistics/289653/tv-shows-release-preference-us/?__sso_cookie_checker=failed (last visited March 26, 2025)
Preference on number of TV show episodes watched per sitting in the United States as of February 2023 [Graph], MediaPost (@MediaPost), February 12, 2023. [Online]. Available: https://www.statista.com/statistics/289653/tv-shows-release-preference-us/?__sso_cookie_checker=failed