Over the past 75 years, women have generally had a higher life expectancy than men by around 4-6 years. Reasons for this difference include higher susceptibility to childhood diseases among males; higher rates of accidental deaths, conflict-related deaths, and suicide among adult men; and higher prevalence of unhealthy lifestyle habits and chronic illnesses, as well as higher susceptibility to chronic diseases among men. Therefore, men not only have lower life expectancy than women overall, but also throughout each stage of life.
Throughout the given period, there were notable dips in life expectancy for both sexes, including a roughly four year drop in 1960 due to China's so-called Great Leap Forward, and a 1.8 year drop due to the Covid-19 pandemic in 2021.
Across the world, differences in life expectancy can vary between the sexes by large margins. In countries such as the Nordics, for example, the difference is low due to high-quality healthcare systems and access, as well as high quality diets and lifestyles. In Eastern Europe, however, the difference is over 10 years in Russia and Ukraine due to the war, although the differences were already very pronounced in this region before 2022, in large part driven by unhealthier lifestyles among men.
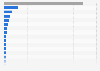
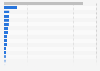
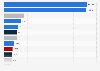
Global life expectancy at birth by gender from 1950 to 2023, with projections until 2100
Characteristic
Men
Women
2100
79.8
83.7
2099
79.7
83.7
2098
79.6
83.6
2097
79.5
83.5
2096
79.5
83.4
2095
79.4
83.3
2094
79.3
83.3
2093
79.2
83.2
2092
79.1
83.1
2091
79
83
2090
78.9
82.9
2089
78.8
82.8
2088
78.7
82.8
2087
78.6
82.7
2086
78.5
82.6
2085
78.4
82.5
2084
78.3
82.4
2083
78.2
82.4
2082
78.1
82.3
2081
78
82.2
2080
77.9
82.1
2079
77.8
82
2078
77.7
82
2077
77.6
81.9
2076
77.5
81.8
2075
77.4
81.7
2074
77.3
81.6
2073
77.2
81.6
2072
77.1
81.5
2071
77
81.4
2070
76.9
81.3
2069
76.8
81.2
2068
76.7
81.1
2067
76.6
81
2066
76.5
81
2065
76.4
80.9
2064
76.3
80.8
2063
76.1
80.7
2062
76
80.6
2061
75.9
80.5
2060
75.8
80.4
2059
75.7
80.3
2058
75.6
80.2
2057
75.5
80.1
2056
75.3
80.1
2055
75.2
80
2054
75.1
79.9
2053
75
79.8
2052
74.9
79.7
2051
74.8
79.6
2050
74.7
79.5
2049
74.5
79.4
2048
74.4
79.3
2047
74.3
79.2
2046
74.2
79.1
2045
74
79
2044
73.9
78.8
2043
73.8
78.7
2042
73.6
78.6
2041
73.5
78.5
2040
73.3
78.4
2039
73.2
78.2
2038
73
78.1
2037
72.9
78
2036
72.7
77.9
2035
72.6
77.7
2034
72.4
77.6
2033
72.3
77.5
2032
72.1
77.3
2031
72
77.2
2030
71.8
77
2029
71.7
76.9
2028
71.5
76.7
2027
71.3
76.6
2026
71.2
76.4
2025
70.9
76.2
2024
70.7
76
2023
70.5
75.9
2022
70
75.4
2021
68.3
73.5
2020
69.3
74.7
2019
70.1
75.2
2018
69.8
75
2017
69.5
74.7
2016
69.3
74.5
2015
69.1
74.2
2014
68.9
74
2013
68.6
73.7
2012
68.3
73.4
2011
67.9
73
2010
67.6
72.7
2009
67.1
72.3
2008
66.8
71.9
2007
66.5
71.6
2006
66.1
71.2
2005
65.7
70.7
2004
65.3
70.3
2003
65
69.9
2002
64.6
69.6
2001
64.3
69.2
2000
64
68.9
1999
63.6
68.5
1998
63.3
68.2
1997
63.1
68
1996
62.7
67.7
1995
62.4
67.5
1994
61.8
66.9
1993
61.9
67
1992
61.8
66.8
1991
61.6
66.5
1990
61.5
66.4
1989
61.4
66.3
1988
61
65.8
1987
60.8
65.6
1986
60.3
65.2
1985
59.8
64.7
1984
59.5
64.3
1983
59.1
64
1982
58.9
63.8
1981
58.5
63.3
1980
58.2
62.9
1979
57.9
62.5
1978
57.3
61.8
1977
56.9
61.4
1976
56.4
60.7
1975
56.1
60.5
1974
55.9
60.2
1973
55.6
59.8
1972
55.1
59.3
1971
53.7
58.4
1970
54.3
58.3
1969
54
58.1
1968
53.6
57.7
1967
53.1
57.1
1966
52.6
56.6
1965
52
56.1
1964
52.4
56.2
1963
51.9
55.6
1962
51.4
55.1
1961
48.6
52.2
1960
46.1
49.6
1959
47.8
51.4
1958
49.9
53.4
1957
49.3
52.8
1956
49
52.5
1955
48.5
51.9
1954
48
51.3
1953
47.2
50.5
1952
46.5
50
1951
45.3
49
1950
44.5
48.4
Zoomable Statistic: Select the range in the chart you want to zoom in on.
Profit from the additional features of your individual account
Currently, you are using a shared account. To use individual functions (e.g., mark statistics as favourites, set
statistic alerts) please log in with your personal account.
If you are an admin, please authenticate by logging in again.
Learn more about how Statista can support your business.
United Nations Department of Economic and Social Affairs (UN DESA). (July 12, 2024). Global life expectancy at birth by gender from 1950 to 2023, with projections until 2100 [Graph]. In Statista. Retrieved March 27, 2025, from https://www.statista.com/statistics/673420/projected-global-life-expectancy/?__sso_cookie_checker=failed
United Nations Department of Economic and Social Affairs (UN DESA). "Global life expectancy at birth by gender from 1950 to 2023, with projections until 2100." Chart. July 12, 2024. Statista. Accessed March 27, 2025. https://www.statista.com/statistics/673420/projected-global-life-expectancy/?__sso_cookie_checker=failed
United Nations Department of Economic and Social Affairs (UN DESA). (2024). Global life expectancy at birth by gender from 1950 to 2023, with projections until 2100. Statista. Statista Inc.. Accessed: March 27, 2025. https://www.statista.com/statistics/673420/projected-global-life-expectancy/?__sso_cookie_checker=failed
United Nations Department of Economic and Social Affairs (UN DESA). "Global Life Expectancy at Birth by Gender from 1950 to 2023, with Projections until 2100." Statista, Statista Inc., 12 Jul 2024, https://www.statista.com/statistics/673420/projected-global-life-expectancy/?__sso_cookie_checker=failed
United Nations Department of Economic and Social Affairs (UN DESA), Global life expectancy at birth by gender from 1950 to 2023, with projections until 2100 Statista, https://www.statista.com/statistics/673420/projected-global-life-expectancy/?__sso_cookie_checker=failed (last visited March 27, 2025)
Global life expectancy at birth by gender from 1950 to 2023, with projections until 2100 [Graph], United Nations Department of Economic and Social Affairs (UN DESA), July 12, 2024. [Online]. Available: https://www.statista.com/statistics/673420/projected-global-life-expectancy/?__sso_cookie_checker=failed