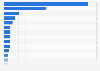
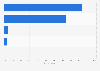
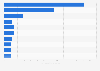
This statistic shows the share of full-service and limited-service restaurant customers in the United States in 2018, by household income. In 2018, 11 percent of the full-service restaurant customers had a household income under 25 thousand U.S. dollars.
Full-service and limited-service restaurant customers in the United States in 2018, by household income
Profit from the additional features of your individual account
Currently, you are using a shared account. To use individual functions (e.g., mark statistics as favourites, set
statistic alerts) please log in with your personal account.
If you are an admin, please authenticate by logging in again.
Learn more about how Statista can support your business.
IFMA. (August 7, 2018). Full-service and limited-service restaurant customers in the United States in 2018, by household income [Graph]. In Statista. Retrieved April 01, 2025, from https://www.statista.com/statistics/808418/us-fsr-and-lsr-customers-by-household-income/?__sso_cookie_checker=failed
IFMA. "Full-service and limited-service restaurant customers in the United States in 2018, by household income." Chart. August 7, 2018. Statista. Accessed April 01, 2025. https://www.statista.com/statistics/808418/us-fsr-and-lsr-customers-by-household-income/?__sso_cookie_checker=failed
IFMA. (2018). Full-service and limited-service restaurant customers in the United States in 2018, by household income. Statista. Statista Inc.. Accessed: April 01, 2025. https://www.statista.com/statistics/808418/us-fsr-and-lsr-customers-by-household-income/?__sso_cookie_checker=failed
IFMA. "Full-service and Limited-service Restaurant Customers in The United States in 2018, by Household Income." Statista, Statista Inc., 7 Aug 2018, https://www.statista.com/statistics/808418/us-fsr-and-lsr-customers-by-household-income/?__sso_cookie_checker=failed
IFMA, Full-service and limited-service restaurant customers in the United States in 2018, by household income Statista, https://www.statista.com/statistics/808418/us-fsr-and-lsr-customers-by-household-income/?__sso_cookie_checker=failed (last visited April 01, 2025)
Full-service and limited-service restaurant customers in the United States in 2018, by household income [Graph], IFMA, August 7, 2018. [Online]. Available: https://www.statista.com/statistics/808418/us-fsr-and-lsr-customers-by-household-income/?__sso_cookie_checker=failed