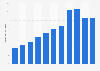
This statistic shows the EBITDA of Limak Group from 2013 to 2019. In 2019, the company had made 1.1 billion U.S. dollars in EBITDA, an increase compared to the previous year.
Annual EBITDA of Limak Group from 2013 to 2019
(in million USD)
Profit from the additional features of your individual account
Currently, you are using a shared account. To use individual functions (e.g., mark statistics as favourites, set
statistic alerts) please log in with your personal account.
If you are an admin, please authenticate by logging in again.
Learn more about how Statista can support your business.
Limak Holding. (January 1, 2021). Annual EBITDA of Limak Group from 2013 to 2019 (in million USD) [Graph]. In Statista. Retrieved March 20, 2025, from https://www.statista.com/statistics/970412/limak-group-ebitda/?__sso_cookie_checker=failed
Limak Holding. "Annual EBITDA of Limak Group from 2013 to 2019 (in million USD)." Chart. January 1, 2021. Statista. Accessed March 20, 2025. https://www.statista.com/statistics/970412/limak-group-ebitda/?__sso_cookie_checker=failed
Limak Holding. (2021). Annual EBITDA of Limak Group from 2013 to 2019 (in million USD). Statista. Statista Inc.. Accessed: March 20, 2025. https://www.statista.com/statistics/970412/limak-group-ebitda/?__sso_cookie_checker=failed
Limak Holding. "Annual Ebitda of Limak Group from 2013 to 2019 (in Million Usd)." Statista, Statista Inc., 1 Jan 2021, https://www.statista.com/statistics/970412/limak-group-ebitda/?__sso_cookie_checker=failed
Limak Holding, Annual EBITDA of Limak Group from 2013 to 2019 (in million USD) Statista, https://www.statista.com/statistics/970412/limak-group-ebitda/?__sso_cookie_checker=failed (last visited March 20, 2025)
Annual EBITDA of Limak Group from 2013 to 2019 (in million USD) [Graph], Limak Holding, January 1, 2021. [Online]. Available: https://www.statista.com/statistics/970412/limak-group-ebitda/?__sso_cookie_checker=failed