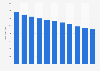
The annual credit union loan growth rate in the United States fluctuated between 2010 and 2024. After rising from 2010 to 2014, it declined until 2020 before surging to a peak of 20 percent in 2022. However, following this peak, loan growth declined significantly.
Credit union loan growth in the United States from 2010 to 2024
Profit from the additional features of your individual account
Currently, you are using a shared account. To use individual functions (e.g., mark statistics as favourites, set
statistic alerts) please log in with your personal account.
If you are an admin, please authenticate by logging in again.
Learn more about how Statista can support your business.
NCUA. (March 6, 2025). Credit union loan growth in the United States from 2010 to 2024 [Graph]. In Statista. Retrieved March 25, 2025, from https://www.statista.com/statistics/892076/credit-union-loan-growth-usa/?__sso_cookie_checker=failed
NCUA. "Credit union loan growth in the United States from 2010 to 2024." Chart. March 6, 2025. Statista. Accessed March 25, 2025. https://www.statista.com/statistics/892076/credit-union-loan-growth-usa/?__sso_cookie_checker=failed
NCUA. (2025). Credit union loan growth in the United States from 2010 to 2024. Statista. Statista Inc.. Accessed: March 25, 2025. https://www.statista.com/statistics/892076/credit-union-loan-growth-usa/?__sso_cookie_checker=failed
NCUA. "Credit Union Loan Growth in The United States from 2010 to 2024." Statista, Statista Inc., 6 Mar 2025, https://www.statista.com/statistics/892076/credit-union-loan-growth-usa/?__sso_cookie_checker=failed
NCUA, Credit union loan growth in the United States from 2010 to 2024 Statista, https://www.statista.com/statistics/892076/credit-union-loan-growth-usa/?__sso_cookie_checker=failed (last visited March 25, 2025)
Credit union loan growth in the United States from 2010 to 2024 [Graph], NCUA, March 6, 2025. [Online]. Available: https://www.statista.com/statistics/892076/credit-union-loan-growth-usa/?__sso_cookie_checker=failed