John Elflein
Research expert covering health and health care

Detailed statistics
Life expectancy of women in the United States 2012-2022
Detailed statistics
Leading causes of death among women in the United States 2020-2022
Detailed statistics
U.S. females who reported their health as fair or poor 2023, by race/ethnicity
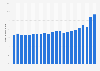
Life expectancy of women in the United States 2012-2022
Life expectancy of women at birth in the United States from 2012 to 2022 (in years)

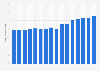
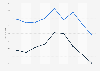
Life Expectancy - Women at the age of 65 years in the U.S. 2001-2021
Life expectancy for women at the age of 65 years in the U.S. from 2001 to 2021
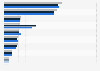
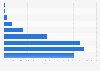
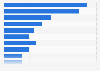
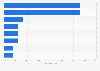
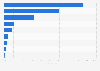
Leading causes of death among women in the United States 2020-2022
Distribution of the 10 leading causes of death among women in the United States from 2020 to 2022
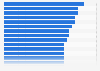
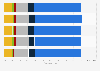
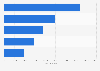
U.S. females who reported their health as fair or poor 2023, by race/ethnicity
Percentage of women in the U.S. who reported fair or poor health status in 2023, by race/ethnicity
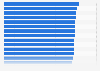
U.S. females who reported their health as fair or poor 2023, by state
Percentage of women in the U.S. who reported fair or poor health status in 2023, by state

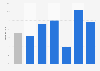
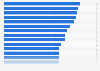
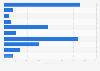
U.S. states with highest rates of obesity among women 2022
States with the highest rates of obese women with a body mass index (BMI) of 30 or higher in the U.S. in 2022
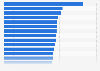
Rates of diabetes among women in the U.S. in 2022, by state and territory
Percentage of women diagnosed with diabetes in the U.S. in 2022, by state and territory
Share of U.S. women who were current smokers in 2023, by state
Percentage of women in the U.S. who were current smokers in 2023, by state

Share of women who used select illicit drugs in the past year in the U.S. in 2022
Percentage of U.S. women who used select illicit drugs in the past year in 2022
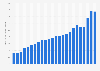
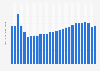
Drug overdose female death rates in the U.S. 1999-2022
Death rate from drug poisoning among women in the U.S. from 1999 to 2022 (per 100,000 population)
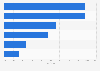
Types of preventive services women had to forgo in the U.S. as of 2022
Share of types of preventive health services women had forgone in the past year in the U.S. as of December 2022

Share of U.S. women aged 50 to 74 who had a mammogram from 1987-2021
Percentage of U.S. women aged 50 to 74 years who had a mammogram within the past 2 years from 1987 to 2021
Share of older U.S. women with a flu shot in the past year as of 2023, by state
Percentage of older women in the United States who received a flu vaccine in the past year as of 2023, by state
Methods of contraception used by U.S. women as of 2024
Percentage of reproductive-aged U.S. women who used select methods of contraception within the past 12 months as of 2024
U.S. women who used contraception within the past 12 months in 2017-2022
Percentage of sexually active women who used contraception within the past 12 months in the United States in 2017, 2020, and 2022
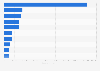
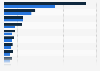
Number of U.S. female cancer survivors as of 2022, by site
Number of female cancer survivors in the U.S. as of January 1, 2022, by site*
Number of U.S. female cancer survivors as of 2022, by age
Number of female cancer survivors in the U.S. as of January 1, 2022, by age*
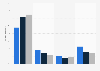
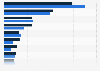
U.S. number of cancer cases among women 2009 and 2025
Estimated number of new cancer cases among women in the U.S. in 2009 and 2025, by cancer type*
U.S. number of cancer deaths among women 2009 and 2025
Estimated number of cancer deaths among women in the U.S. in 2009 and 2025, by cancer type

Deaths from breast cancer in the U.S. 1950-2022
Deaths due to breast cancer in the U.S. from 1950 to 2022 (per 100,000 population)

Rate of corpus uteri cancer deaths in U.S. 1999-2021
Death rate of corpus uteri cancer in the United States from 1999 to 2021 (per 100,000 population)

Rate of cervix uteri cancer deaths in U.S. 1999-2021
Death rate of cervix uteri cancer in the United States from 1999 to 2021 (per 100,000 population)

Rate of ovary cancer deaths in U.S. 1999-2021
Death rate of ovary cancer in the United States from 1999 to 2021 (per 100,000 population)

Mental illness among U.S. women 2008-2022
Percentage of U.S. women who had any mental illness in the past year from 2008 to 2022
Any or serious mental illness in the past year among U.S. women 2023, by age
Percentage of U.S. women with any or serious mental illness in the past year as of 2023, by age
Major depressive episode in the past year among U.S. women 2022, by age
Percentage of U.S. women with a major depressive episode in the past year as of 2022, by age
Suicidal thoughts among U.S. women 2008-2023
Percentage of U.S. women who had serious thoughts of suicide in the past year from 2008 to 2023
Female suicide death rates in the U.S. 1950-2021
Death rate from suicide among women in the U.S. from 1950 to 2021 (per 100,000 population)
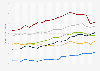
Female suicide rate in the U.S. from 2001 to 2021, by age group
Female suicide rate in the U.S. from 2001 to 2021, by age group (per 100,000 population)
Mental health treatment or counseling among U.S. women 2002-2023
Percentage of U.S. women who received mental health treatment or counseling in the past year from 2002 to 2023
Share of reasons women in U.S. could not access mental health services in 2022
Distribution of reasons women in the U.S. could not get an appointment for needed mental health care in the past two years as of 2022
Women reporting select types of health insurance coverage in the U.S. 2018-2023
Percentage of U.S. women with select types of health insurances from 2018 to 2023
Share of U.S. adults without health insurance by gender 2015-2023
Share of adults aged 18–64 years without health insurance in the United States from 2015 to 2023, by gender

Uninsured U.S. adult women in 2022 by age
Number of adult women without health insurance in the U.S. in 2022, by age (in millions)
U.S. mothers: medical or health characteristics of birth 2023
Selected medical or health characteristics experienced by mothers during pregnancies/births in the United States in 2023
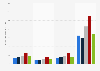
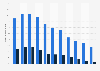
Maternal mortality rates in the U.S. from 2018 to 2023, by age
Maternal mortality rates in the United States from 2018 to 2023, by age (per 100,000 live births)
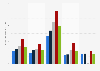
Maternal mortality rates in the U.S. from 2018 to 2023, by race/ethnicity
Maternal mortality rates in the United States from 2018 to 2023, by race/ethnicity (per 100,000 live births)
Leading surgical cosmetic procedures among women in the U.S. 2023
Most performed surgical cosmetic procedures on women in the United States in 2023

Total women's health funding by National Institutes for Health 2013-2025
Total women's health funding by the National Institutes for Health (NIH) from FY 2013 to FY 2025 (in million U.S. dollars)


Mon - Fri, 9am - 6pm (EST)
Mon - Fri, 9am - 5pm (SGT)
Mon - Fri, 10:00am - 6:00pm (JST)
Mon - Fri, 9:30am - 5pm (GMT)
Mon - Fri, 9am - 6pm (EST)